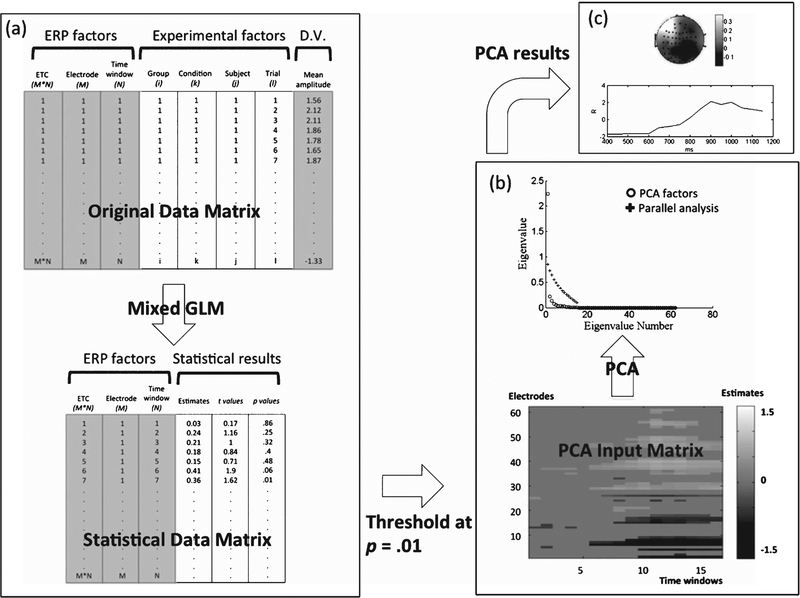
Fig. 1.
Schematic flow chart of the STAT-PCA analysis. STAT-PCA is composed of two main steps: statistical analysis (a) followed by principal component analysis (b). The final results can be represented using both spatial and temporal information (c). Refer to the Methods section for detailed, step-wise descriptions. ETC, electrode-time combination; D.V., dependent variable; GLM, generalized linear modeling.

