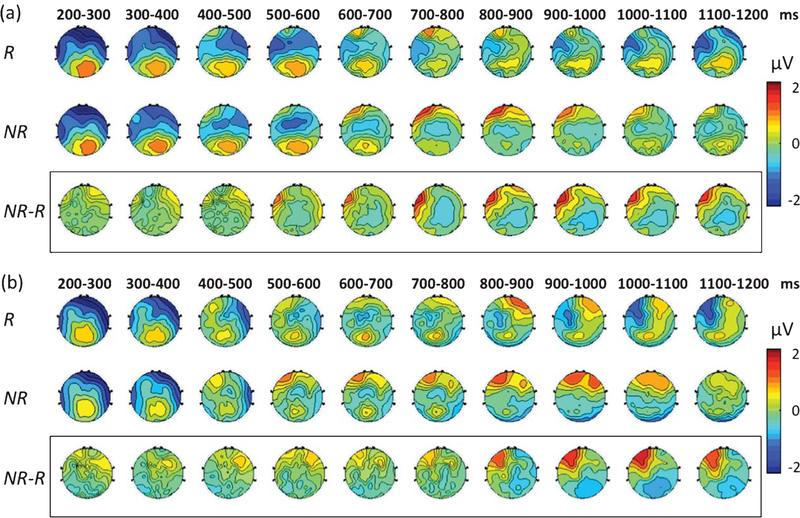
Fig. 4.
Group-level topographical representations of ERP over time. Group level ERPs are illustrated in a topographical fashion for the control(a) and the aMCI group (b) between 200 and 1200 ms post-stimulus. Each scalp map is representative of the mean potentials averaged across each 100-ms time window. R, retrieval trials; NR, non-retrieval trials. NR-R represents the difference ERP.

