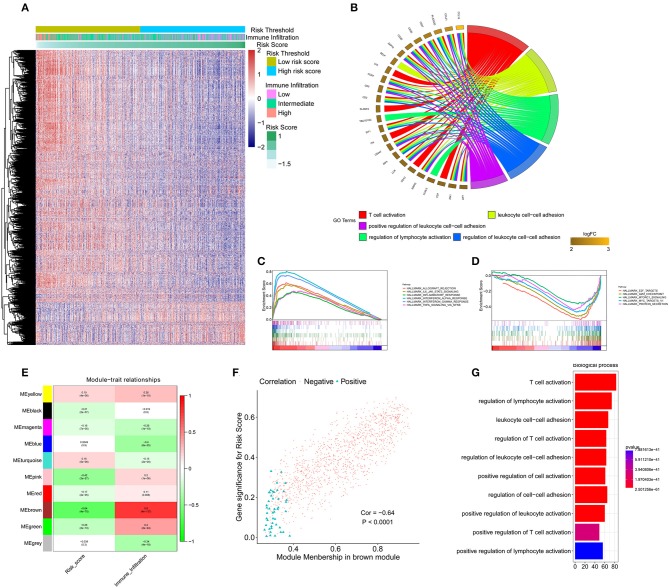
Figure 5.
Functional annotation of the immune signature and WGCNA of the IDC transcriptome. (A) Heatmap showing the transcriptome expression profiles of the low- and high-risk groups. (B) GO analysis based on the significant genes in the comparison between low- and high-risk groups. (C,D) GSEA revealed that most significant hallmarks correlated with the immune signature. (E) Correlation between modules and traits. (F) The correlation between module membership and gene significance in the brown module. (G) GO analysis based on the hub genes in the brown module. GO, gene ontology; GSEA, gene set enrichment analysis.

