Figure 1.
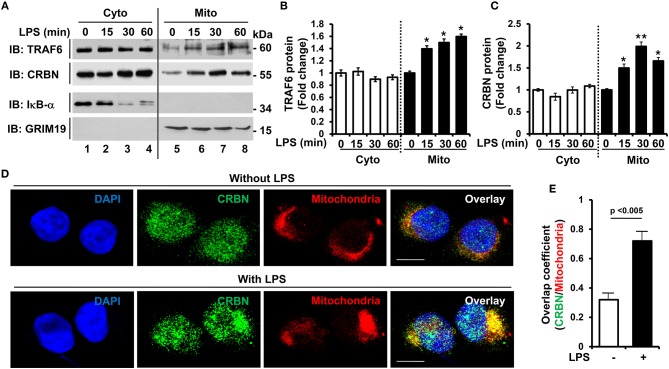
CRBN is localized in mitochondria in response to TLR4 stimulation. (A) THP-1 cells were treated with or without LPS (200 ng/ml) for different times, as indicated. Subcellular fractions, cytosolic (Cyto) and mitochondrial (Mito) fractions, were isolated, and western blot analysis was performed with antibodies, anti-TRAF6, anti-CRBN, anti-IκB-α as a cytosolic marker, and anti-GRIM19 as a mitochondrial marker. (B,C) Band intensity of TRAF6 (B), and CRBN (C) was analyzed with Image J program. Data shown are averages from a minimum of 3 independent experiments (± SEM). *p < 0.05, **p < 0.01, when compared to that of without LPS. (D) THP-1 cells were treated with or without LPS (200 ng/ml) for 30 min, and confocal microscopy analysis was performed as described in the Materials and Methods (scale bar = 20 μm). (E) Overlap coefficients of CRBN and mitochondria were calculated, and represented [n = (10–15) cells].

