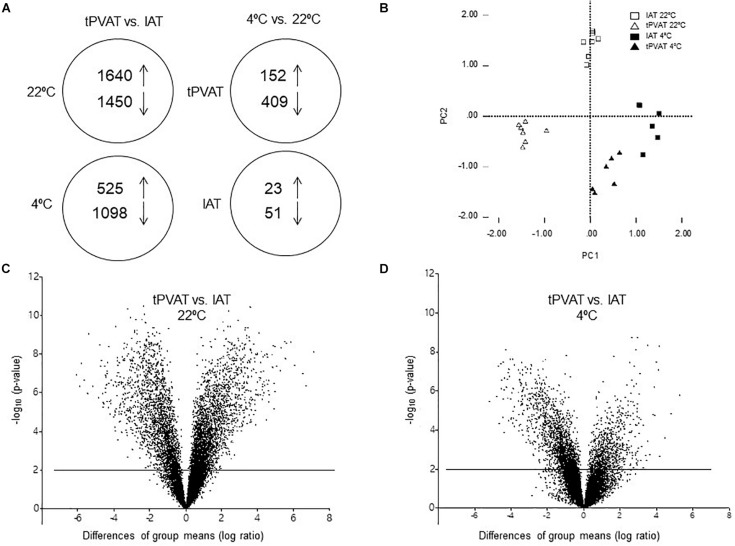
FIGURE 3.
(A) Schematic overview of regulated genes in tPVAT and in IAT in control (22°C) vs. cold (4°C) exposed ferrets (Student’s t-test, p-value < 0.01, with an absolute fold change ≥ 2). The arrows show the number of genes up- and down-regulated in each analysis. (B) PCA analysis of gene expression in tPVAT and IAT at 22 and 4°C of a subset of genes being differentially expressed in tPVAT vs. IAT at control (22°C) temperature (Student’s t-test, p-value < 0.01, with an absolute fold change ≥ 2). Volcano plot for all expressed probes in control (C) and cold conditions (D). Minus log10 p-value of all genes are plotted against the differences of group means (log ratio) of each gene, tPVAT vs. IAT. The line indicates the threshold p-value < 0.01. The results represent data from the control (n = 7) and cold (n = 6–7) groups.

