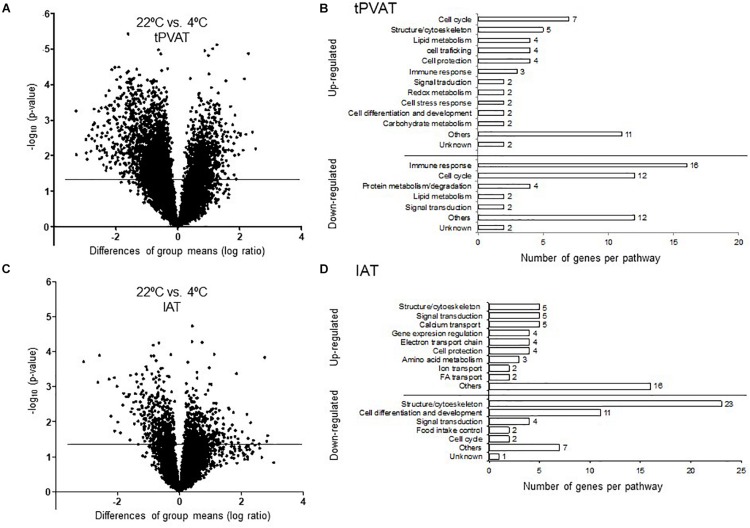
FIGURE 4.
Volcano Plot for all expressed probes by microarray analysis in tPVAT (A) and IAT (C). Minus log10 p-value of all genes are plotted against the differences of group means (log ratio) of each gene, cold vs. control. The line indicates the threshold p-value < 0.05. Detailed manual classification of the 50 top up- and down-regulated genes based on their fold change (Student’s t-test, p-value < 0.05) in tPVAT (B) and in IAT (D). The results represent data from the control (n = 7) and cold (n = 6–7) groups.

