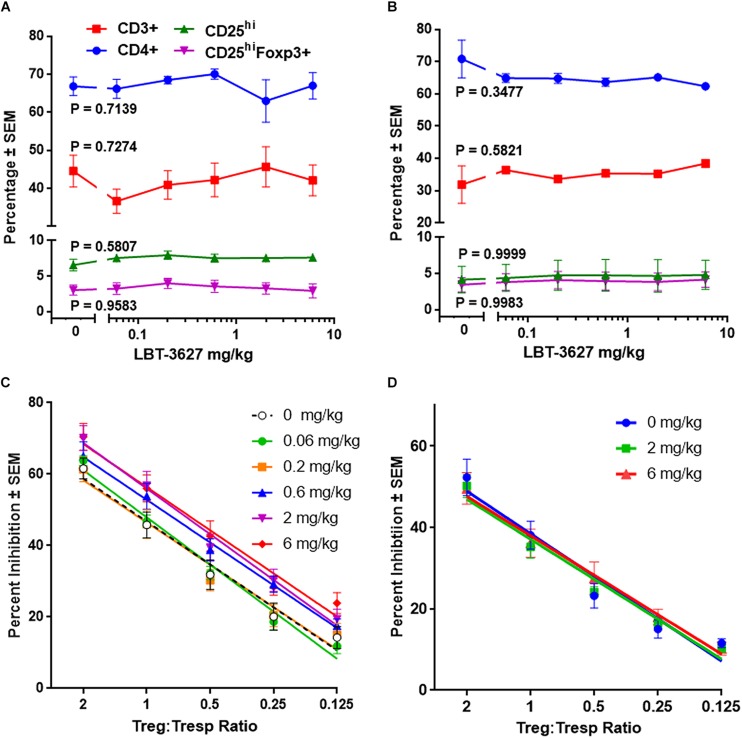
FIGURE 1.
Multiple doses of VIPR2 agonist augments Treg activity. Naïve Lewis rats were administered 5 daily s.c. injections of PBS vehicle (designated 0) or LBT-3627 at doses of 0.06, 0.2, 0.6, 2.0, or 6.0 mg/kg (n = 5 rats/group). One day after last injection, cells from peripheral blood (A) and spleens (B) were assessed for T cell and Treg frequencies. Percentages of cell populations included CD3+ T cells among lymphocytes (red circles), CD4+ T cells among CD3+ cells (blue squares), CD25hi T cells among CD3+CD4+ cells (green triangles), and CD25hiFoxp3+ among CD3+CD4+ cells (purple inverted triangles). Mean percentages and SEMs were determined from 5 rats/group and significant differences between dosages were assessed for each population by one-way ANOVA. P values for each T cell population are denoted next to the concentration curve. (C) Spleen cells obtained from the above multiple-dosed animals (B) or from rats receiving a single s.c. dose of LBT-3627 at 2.0 or 6.0 mg/kg (n = 5 rats/group) (D) were enriched for CD3+CD4+CD25hi Tregs and assessed for Treg function. Percent Treg-mediated suppression was determined by flow cytometric analysis. Significant differences were determined from linear regression analysis with 5 rats/group and triplicate assays for each rat. Regression analysis for all lines indicated that R2 > 0.96 with P values < 0.0054.

