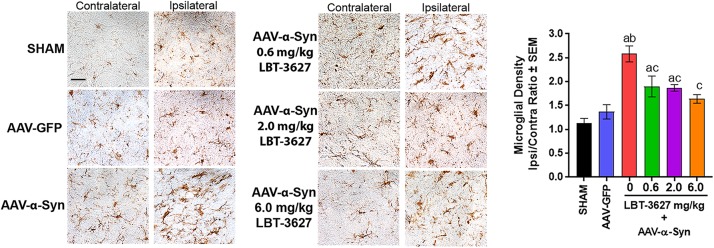
FIGURE 5.
VIPR2 agonist diminishes microglial response to α-Syn overexpression. Sprague-Dawley rats were treated as sham control (n = 5) or stereotactically injected with AAV-GFP (N = 6) or AAV-α-Syn vector (n = 6–7/group). AAV-α-Syn-treated rats started the same regimen as in Figure 4 of vehicle (0) (n = 7) or LBT-3627 administered at 0.6, 2.0, or 6.0 mg/kg (n = 6/group). On day 28 after infection, brains were obtained and sections of midbrain were stained for expression of Iba1 by microglia. Numbers of Iba1+ amoeboid microglia were determined by stereological analysis. Means and SEM were determined from 5 to 7 rats/group. Significant differences were assessed by one-way ANOVA and Newman-Keuls post hoc tests. P ≤ 0.05 compared to treatments as asham controls, bAAV-GFP, or AAV-α-Syn and cPBS. Scale bar, 40 μm.

