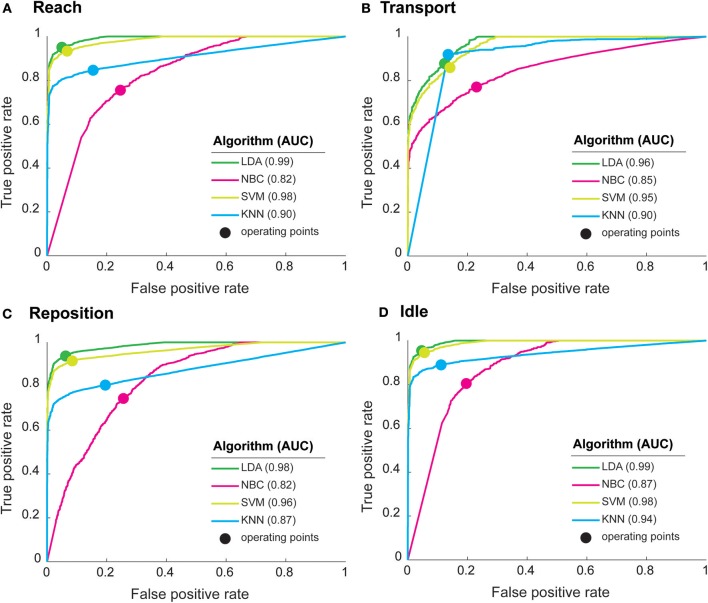
Figure 3.
Performance characteristics of machine learning algorithms for (A) Reach, (B) Transport, (C) Reposition, and (D) Idle. Receiver operating characteristic (ROC) curves show the trade-off between true positive rate (or sensitivity) and false positive rate (1-specificity). Curves closer to the top-left corner indicate a better classification performance. The optimal operating point for each algorithm (solid circles), reflect the best tradeoff between sensitivity and specificity for an algorithm. The area under the curve (AUC), a measure of classification performance, is shown in parenthesis for each algorithm. AUC = 1 represents perfect classification. LDA had the highest AUCs followed closely by SVM, indicating high classification performances. NBC had consistently the lowest AUCs, indicating the weakest classification performance.

