Figure 2.
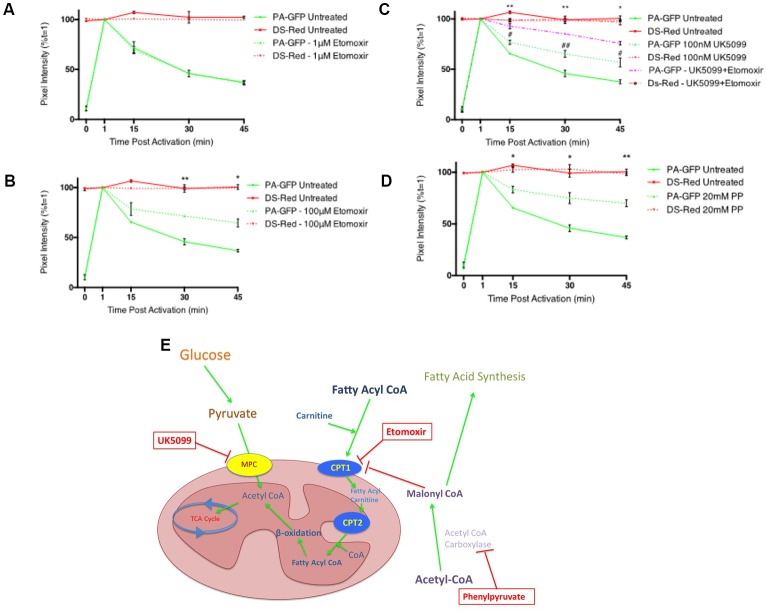
Inhibitors of fatty acid metabolism and pyruvate transport decrease mitochondrial fusion dynamics in differentiated PC12 cells. (A,B) Quantitative data shows inhibition of fusion by 100 μM etomoxir treated cells (dashed green line) compared to controls (bold green line) while no inhibition of fusion was observed in cells treated with 1 μM etomoxir. (C) Quantitative data shows synergistic inhibition of fusion in UK5099 treated cells (dashed green line) compared to controls (bold green line) and 100 μM etomoxir + UK5099 treated cells (dashed magenta line). #Indicates significant differences between UK5099 treated cells and untreated cells while *indicates significant differences between UK5099 treated cells and cells treated with UK5099 + etomoxir. (D) Quantitative data shows inhibition of fusion in phenylpyruvate treated cells (dashed green line) compared to controls (bold green line). (E) Diagram of inhibitor targets. Data presented as mean ± SEM, n = 3. Unpaired t-test at each time point with Welch correction for unequal variance. Results which were significantly different from controls are shown with *p ≤ 0.05, **p ≤ 0.01, #p ≤ 0.05, ##p ≤ 0.01.

