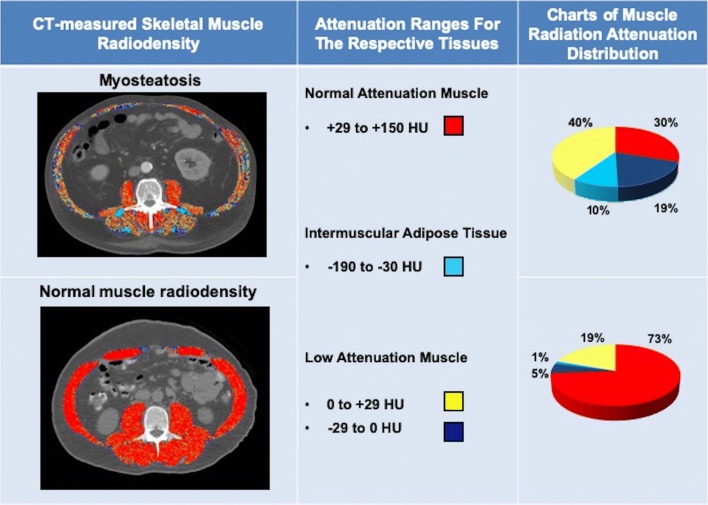
Fig. 2.
Computed tomography images used for the muscle radiodensity assessment in patients with cirrhosis. Comparison of two patients with cirrhosis and similar BMI. Attenuation ranges used for the analysis of normal attenuation (red), low attenuation region 1 (yellow), and low attenuation region 2 (dark blue) muscle, as well as intermuscular adipose tissue (IMAT; teal), are shown. In patient with low muscle attenuation (34 HU) or myosteatosis, less than half of the muscle cross-sectional area falls within the normal attenuation range whereas in patient with normal muscle attenuation (47 HU, no-myosteatosis), muscle with the normal attenuation range is predominant

