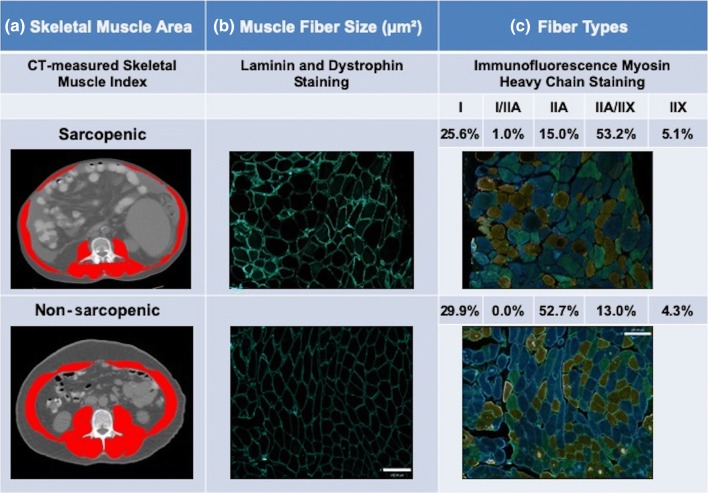
Fig. 3.
Abdominal computed tomography images taken at the 3rd lumbar vertebra to quantify total muscle cross-sectional area and rectus abdominis muscle morphological characteristics. Reduction in skeletal muscle mass in sarcopenia, identified by CT images, is detectable at the microscopic level by reduction in muscle fiber size and muscle fiber type transformation. a Red color designates skeletal muscles. Sarcopenic patient had had low SMI (43 cm2/m2) whereas in non-sarcopenic patient, SMI was 51 cm2/m2. b Muscle fiber boundaries were demarked using laminin and dystrophin stain (cell membrane) for muscle fiber size calculation. c Fiber types were identified in rectus abdominis muscle by using immunofluorescence myosin heavy-chain staining technique. Sarcopenic patient has mostly type IIA/IIX fibers (blue/green) whereas type IIA fibers (blue) were more frequent in non-sarcopenic patient. Scale bar = 130 µm

