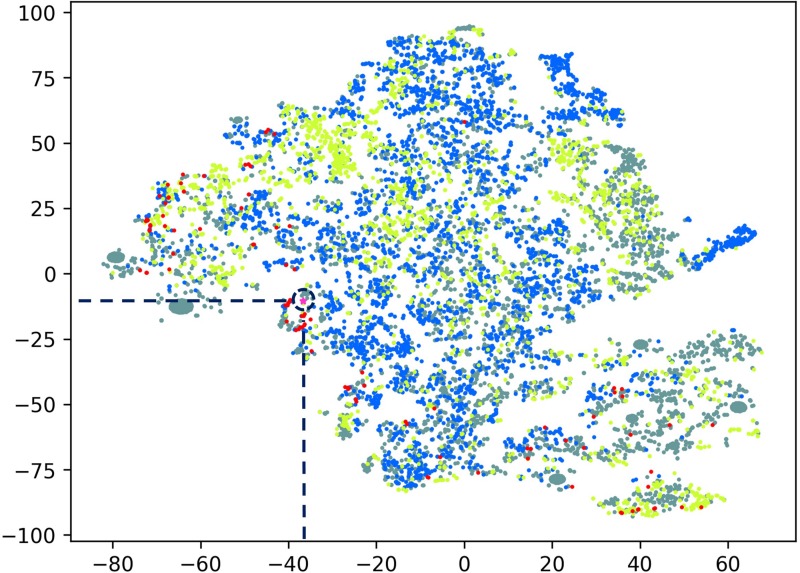
FIGURE 2.
T-distributed Stochastic Neighbor Embedding (t-SNE) plot comprising all peptide data used in this study. Peptide sequences were transformed using all physiochemical features, averaged by peptide length. Gray: non-active peptides; yellow: active peptides; blue: peptides from mass spectrometry; red: top active peptides; Pink star: NuriPep 1653 (identified with a navy blue broken circle).

