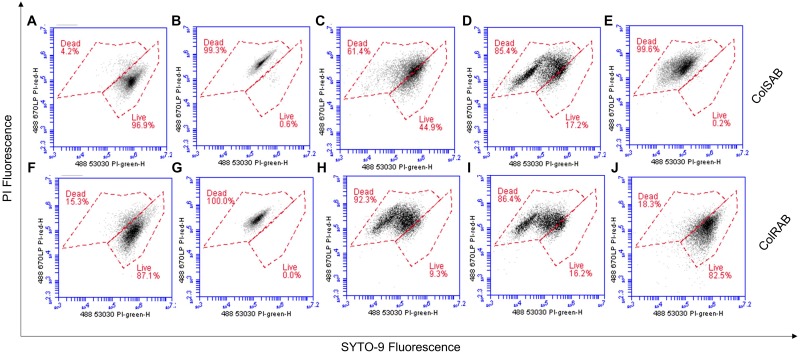
FIGURE 7.
Analysis of the effects of NuriPep 1653 on the membrane integrity and viability of colRAB and colSAB. Quantification of viable versus non-viable cells represented by the uptake of fluorescent PI in (A) untreated colSAB; (B) heat inactivated colSAB at 95°C for 60 min; (C) colSAB treated with NuriPep 1653 at 12 μg/mL; (D) colSAB treated with magainin 2 at 12 μg/mL; (E) colSAB treated with colistin at 4 μg/mL; (F) untreated colRAB; (G) heat inactivated colRAB at 95°C for 60 min; (H) colRAB treated with NuriPep 1653 at 12 μg/mL; (I) colRAB treated with magainin 2 at 12 μg/mL; (J) colSAB treated with colistin at 4 μg/mL. A minimum of 50,000 single events were collected per sample. Data is displayed as scatter plots of PI fluorescence (y-axis) and SYTO-9 fluorescence (x-axis). When used alone, the SYTO9 stain generally labels all bacteria in a population. In contrast, PI penetrates only bacteria with damaged membranes, causing a reduction in the SYTO9 stain fluorescence when both dyes are present. Therefore, bacteria with intact cell membranes stain fluorescent green, whereas bacteria with damaged membranes stain fluorescent red. Optical densities of bacteria were optimized for cell events.

