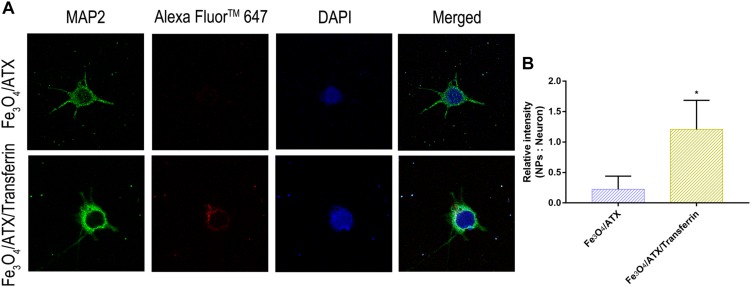
FIGURE 5.
Comparison of neuronal uptake between Fe3O4/ATX and Fe3O4/ATX/Transferrin. (A) Typical confocal images showed primary cultured neurons in Fe3O4/ATX group and Fe3O4/ATX/Transferrin group at 6 h after incubation. (B) The intensity in relative fluorescence of Nanoparticles: Neurons. Images were standardized to the same setting. The green, the blue, and the red indicates fluorescence of MAP2, DAPI, and AF647-labeled NPs, respectively. Values are expressed as the means ± SEM. ∗p < 0.05 vs. Fe3O4/ATX group; ns p > 0.05 vs. Fe3O4/ATX group.

