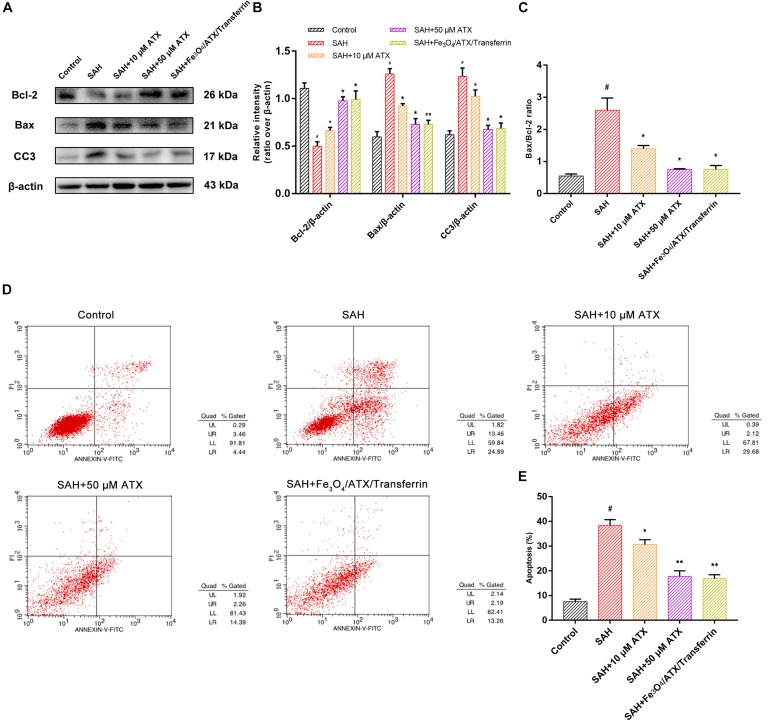
FIGURE 7.
Comparison between ATX and Fe3O4/ATX/Transferrin treatment on neuronal damage in cultured neurons exposed to OxyHb. (A) Representative Western blots showed the expression of Bcl-2, Bax, and cleaved caspase-3 (CC3) at 12 h after OxyHb exposure in different groups. (B,C) Relative intensity analysis of Bcl-2, Bax, cleaved caspase-3 (CC3) and β-actin among all experimental groups, respectively. (D) Apoptosis detection results after OxyHb exposure were detected by flow cytometry. (E) The ratio of apoptotic cells in each group was measured. Values are expressed as the means ± SEM. #p < 0.05 vs. Control group; ∗p < 0.05 vs. SAH group; ∗∗p < 0.01 vs. SAH group.

