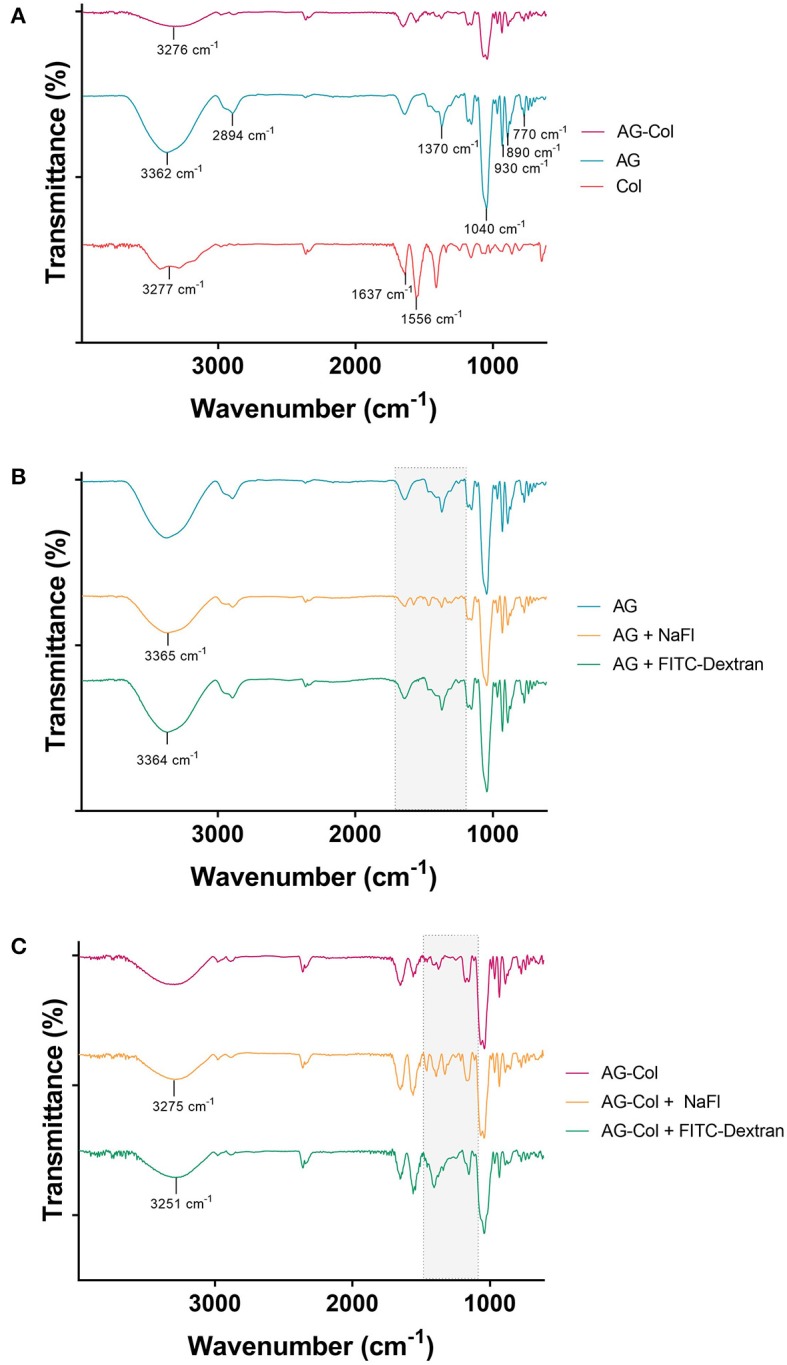
Figure 3.

FTIR Spectra of (A) AG-Col, AG, Col (B) AG, AG + NaFl and AG + FITC-Dextran 10 kDa, and (C) AG-Col, AG-Col + NaFl and AG-Col + FITC-Dextran 10 kDa. Shaded “fingerprint” areas represent regions where changes and potential interactions are visible between the different spectra.
