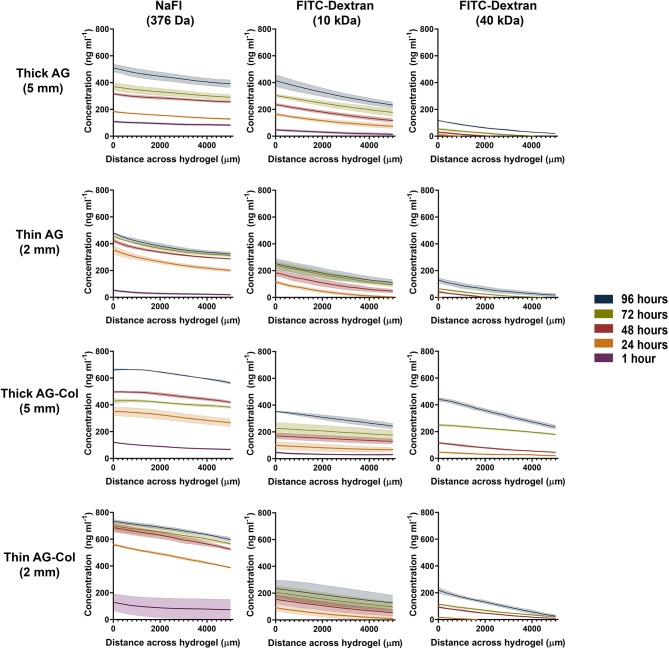
Figure 4.
Concentration gradient profiles of NaFl (376 Da), FITC-Dextran (10 kDa) and FITC-Dextran (40 kDa) measured at various time points after setup. Concentration profile was determined across the central hydrogel chamber where 0–5,000 μm corresponds with the central 2,500–7,500 μm region of the hydrogel. The outer 2,500 μm from either end was excluded to avoid interference by the meniscus. Each data point represents the mean ± SD error bands.

