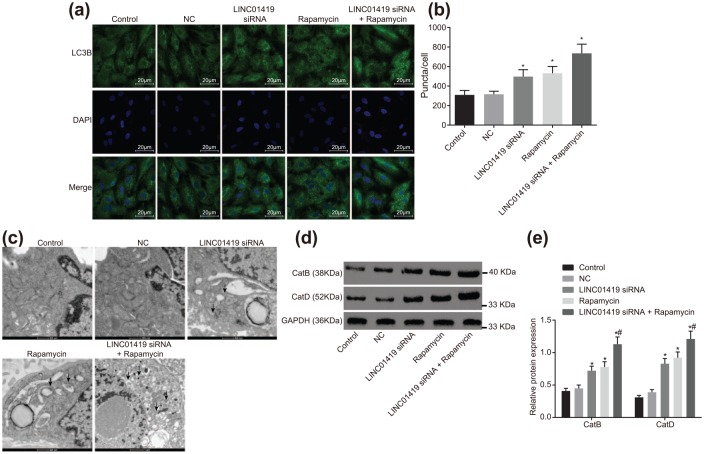
Figure 5.
LINC01419 siRNA and Rapamycin treatment promotes MGC-803 cell autophagy. (a) Immunofluorescence staining, where LC3B indicates the localization of LC3B in the cells, DAPI indicates nuclear localization, and Merge indicates localization of both. (b) Fluorescence intensity of LC3B in cells transfected with LINC01419 siRNA, Rapamycin, and LINC01419 siRNA + Rapamycin. (c) Observation of autophagic structure of GC cells in each group by transmission electron microscope, where arrows indicate autophagy lysosomes. (d) Gray value of CatB and CatD protein bands in response to LINC01419 siRNA, Rapamycin, and LINC01419 siRNA + Rapamycin treatment assessed by Western blot analysis. (e) Protein expression of CatB and CatD in response to LINC01419 siRNA, Rapamycin, and LINC01419 siRNA + Rapamycin treatment assessed by Western blot analysis; measurement data were presented as mean ± standard deviation and compared by one-way ANOVA followed by Tukey’s post hoc test; *p < 0.05 versus the NC group; #p < 0.05 versus the Rapamycin group; the experiment was repeated three times.
ANOVA, one-way analysis of variance; Cat, cathepsins; DAPI, 4’,6-diamidino-2-phenylindole; LC3B, light chain 3B; mTOR, mammalian target of rapamycin; NC, negative control.

