
Figure 3.
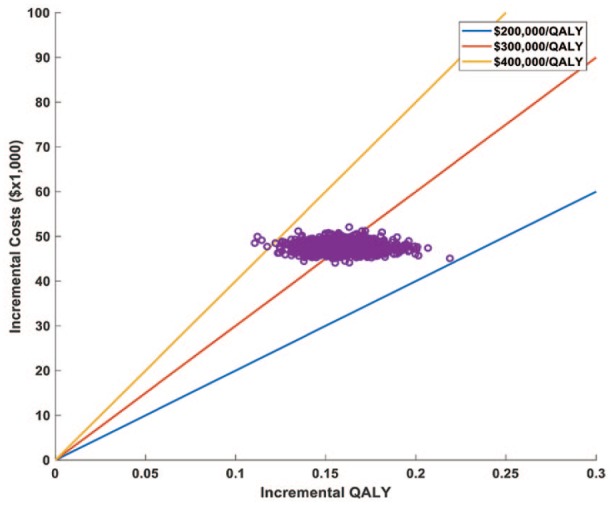
A probabilistic sensitivity analysis using the Monte Carlo simulation plot assuming a median cabozantinib dose of 36 mg daily. Each dot represents a separate run of the model with different input values for each variable randomly selected according to their distribution (see the methods section). The dots cluster between US$200,000 and US$400,000$/QALY.
QALY, quality-adjusted life-years.