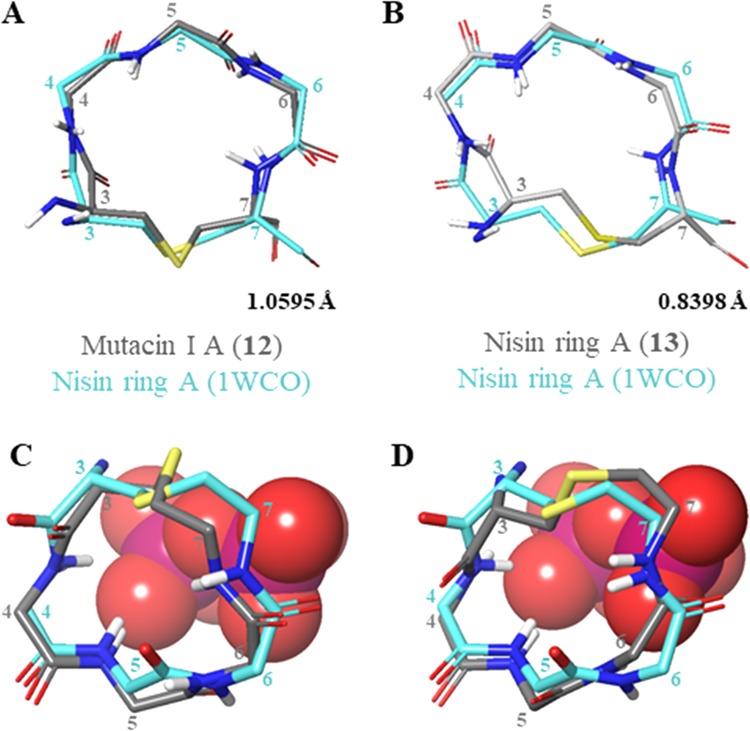
Figure 11.

(A) Comparison of 1WCO to 12. (B) Comparison of 1WCO to 13. (C) Overlay of 12 with nisin ring A and the lipid II pyrophosphate from 1WCO. (D) Overlay of 13 with nisin ring A and the lipid II pyrophosphate from 1WCO. Pyrophosphate is shown in space-filling representation with phosphorus atoms in magenta and oxygen atoms in red. Figures were produced in Maestro (version 11.4, Schrödinger, LLC) by alignment of αC and S atoms within the lantibiotic rings. Side chains (excluding Pro), nonpolar hydrogens, and nonring residues have been omitted for clarity. Representative structures (closest to the average) were used for comparison. Residues are numbered from the full-length parent peptide.
