FIG 2.
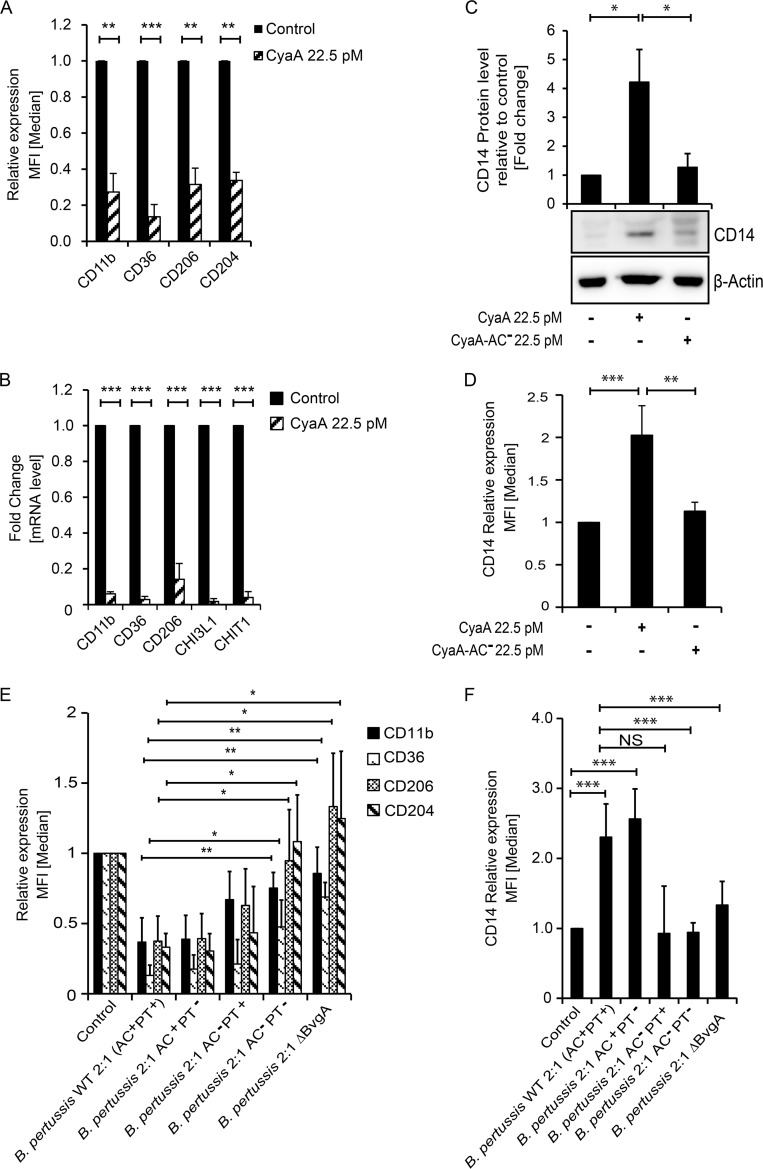
CyaA toxin activity subverts M-CSF-elicited monocyte-macrophage transition. CD14+ monocytes were cultured for 5 days in DMEM–20 ng/ml M-CSF and 22.5 pM CyaA or CyaA-AC− (A) FACS analysis of relative levels of cell surface expression of macrophage markers. The median fluorescence intensity (MFI) values shown represent means ± standard deviations (SD). n = ≥7; **, P < 0.05; ***, P < 0.0005. (B) qPCR analysis of transcript levels of macrophage marker genes. The fold change values are means ± SD, n ≥ 7 biological replicates performed in duplicates; ***, P < 0.0005. (C) CyaA inhibits downregulation of CD14 marker expression on monocytes. Levels of the CD14 marker protein in cellular lysates were analyzed by densitometry of immunoblots of whole-cell lysates and expressed as fold change, assigning the CD14 level of mock-treated cells a value of 1. The values were normalized to the β-actin protein level used as a loading control. Values are means ± SD, n = 3; *, P < 0.05. (D) Cell surface expression of CD14 detected by flow cytometry. (E) CD14+ monocytes were infected by wild-type and mutant strains of B. pertussis CIP 81.32 Tohama I at MOI 2:1 for the first 12 h of culture. Bacteria were next killed by the use of 50 μg/ml polymyxin B plus 50 μg/ml kanamycin for an additional 12 h. At 5 days later, after repeated medium replacement, the expression levels of macrophage markers were analyzed by flow cytometry. (F) CD14+ monocytes were treated as described above, and surface expression levels of the CD14 marker were determined by flow cytometry. The MFI values are indicated as means ± SD, n ≥ 3 biological replicates; *, P < 0.05; **, P < 0.005; ***, P < 0.0005.

