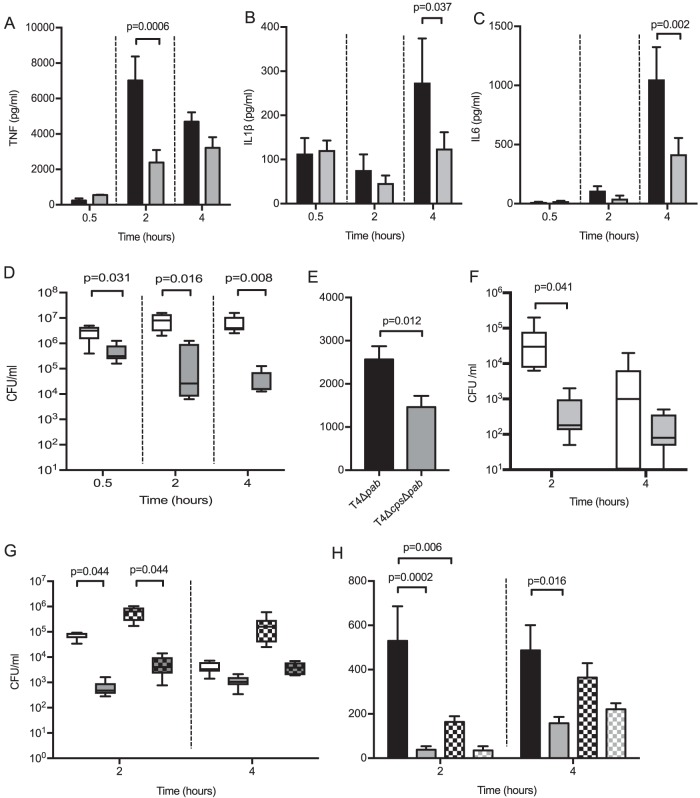
FIG 5.
(A to D) Six-week-old female CD1 mice were infected with 5 × 10⁶ CFU of either TIGR4 or TIGR4 Δcps, with 6 mice in each group. At various time points, mice were sacrificed, and BALF was retrieved and analyzed for (A) TNF, (B) IL-1β, and (C) IL-6. The results were analyzed by unpaired t test. (D) Bacterial CFU in BALF was measured at the same time points, as analyzed by Mann-Whitney U test. (E and F) Six-week-old female CD1 mice were infected with 5 × 10⁶ CFU of either TIGR4 Δpab or TIGR4 Δcps Δpab, with 6 mice in each group, and after 2 h, mice were sacrificed and BALF was retrieved and analyzed for (E) TNF levels, as analyzed by unpaired t test, and (F) bacterial CFU in BALF was measured at the same time points, as analyzed by Mann-Whitney U test. (G and H) Six-week-old female CD1 mice were given intranasal liposomes or liposomal clodronate 72 h prior to infection with 5 × 10⁵ CFU of either TIGR4 or TIGR4 Δcps, with 6 mice in each group. After 2 and 4 h, mice were sacrificed and BALF was retrieved for (G) bacterial CFU, as analyzed by Kruskal-Wallis test with Dunn’s multiple-comparison test and (H) TNF levels, as analyzed by 1-way ANOVA and Tukey’s multiple-comparison test. Black bars represent TIGR4 data and gray bars TIGR4 Δcps data, with data from clodronate-treated mice shown as checked bars (as seen in panels G and H). For panels D and G, white boxes and whisker plots represent TIGR4 and gray ones TIGR4 Δcps, with data from clodronate-treated mice in checked bars. In panel F, TIGR4 Δpab data are displayed as white whisker plots, with TIGR4 Δcps Δpab data as gray plots.

