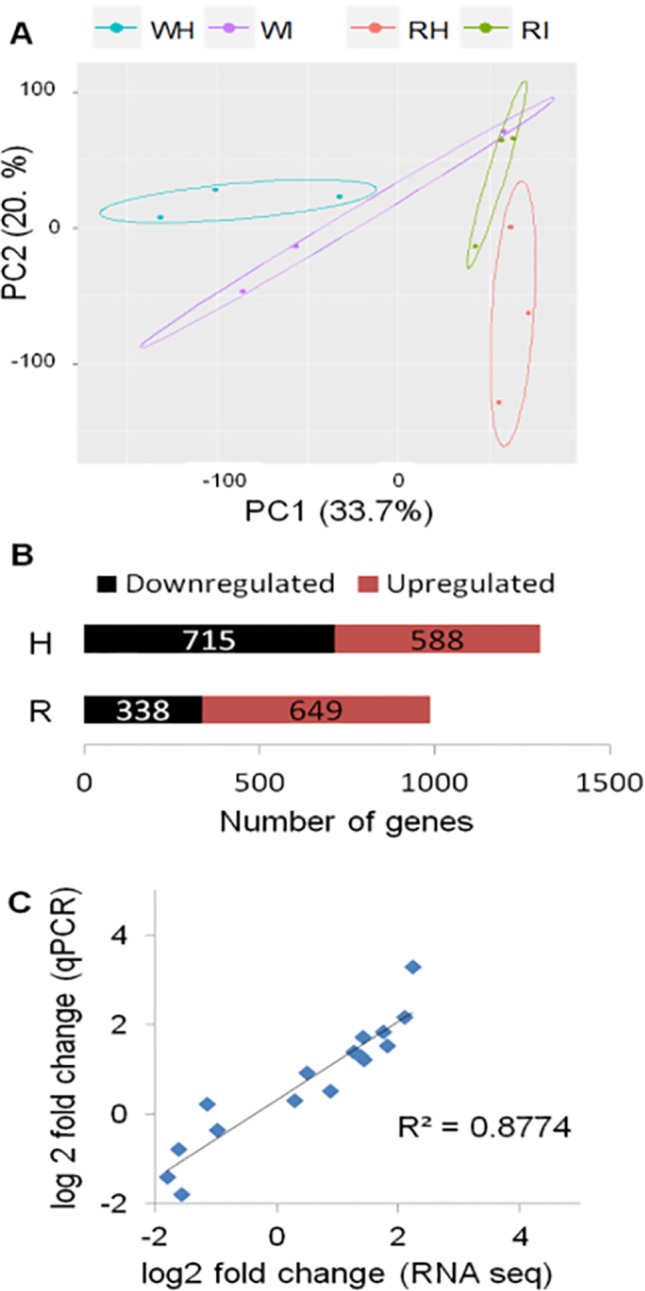
Figure 2.

Global evaluation of the RNA-seq data and of the differentially expressed (DE) genes at 24 h postinoculation (hpi). (A) Principal component analysis displaying the biological variations of Fragaria vesca genes among samples. W, white fruit; R, red fruit; H, healthy (mock inoculated); I, Botrytis cinerea inoculated. Raw count data were used after precision weight was calculated by the voom method (Law et al., 2014). (B) Number of DE genes (P < 0.05, absolute fold change >1.74) upon B. cinerea inoculation at 24 hpi; downregulated genes (black) and upregulated genes (red). (C) Comparison of gene expression values of RNA-Seq and qRT-PCR: correlation of fold change values for eight F. vesca genes obtained by RNA-Seq and qRT-PCR.
