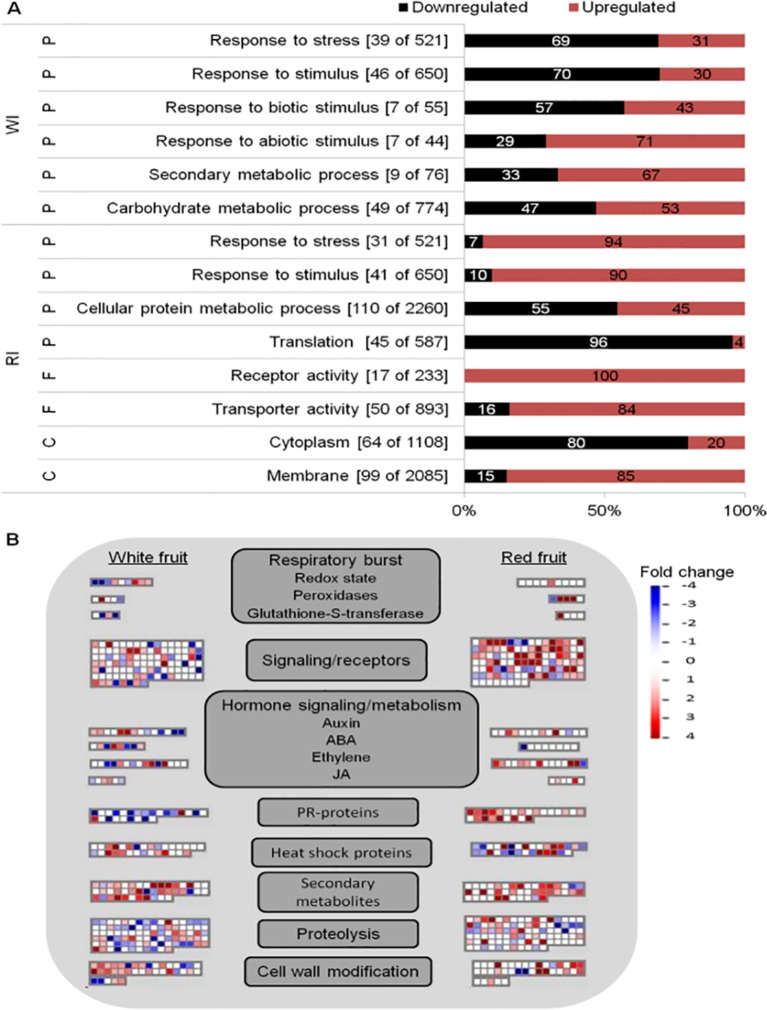
Figure 3.
Functional enrichment and biotic stress overview of the differentially expressed (DE) genes of Fragaria vesca in Botrytis cinerea inoculated white and red fruits, 24 h postinoculation. (A) Functionally enriched classes in the DE genes of white inoculated (WI) and red inoculated (RI) fruits, using AgriGO analysis tool. The number of DE genes out of the total F. vesca genes in each category is shown in parenthesis. The proportion of down- and upregulated genes within a category is represented by black and red bars, respectively. C, cellular component; F, molecular function; P, biological process. (B) Overview of biotic stress changes in infected fruits, visualized by MapMan. Up- and downregulated genes are shown in red and blue, respectively. The scale bar displays fold change values; fold change value “0” is given for genes which are not DE. ABA, abscisic acid; JA, jasmonic acid.

