Figure 1.
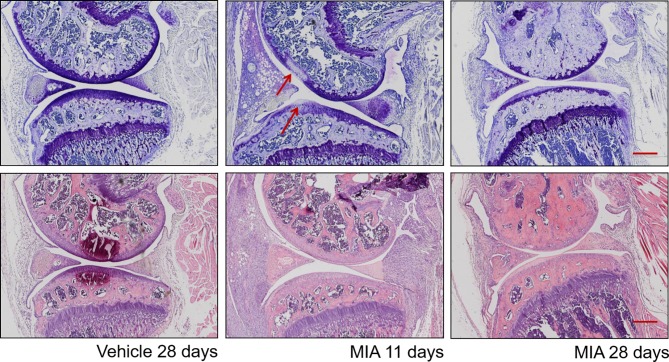
Histopathological progression in the monosodium iodoacetate model of osteoarthritis. Top plane: Representative sections at different time points post–MIA injection (1 mg/mouse) stained with toluidine blue/purple, with femoral condyle at the top and tibial plateau at the bottom. (Left) Vehicle-injected joint with full-depth normal cartilage and normal subchondral bone structure. (Middle) Eleven days after MIA injection, visible focal cartilage damage and loss of proteoglycan staining (arrows) in both femoral and tibial condyles. (Right) Twenty-eight days after MIA injection, marked thinning of the whole articular surface, loss of proteoglycan staining, and restructuring of subchondral bone. Bottom plane: Representative sections at different time points post–MIA injection (1 mg/mouse) stained with hematoxylin and eosin. (Left) Vehicle-injected joint with normal synovium and few inflammatory cells visible. (Middle) At 11 days, there are obvious signs of inflammation: the synovial membrane is expanded, with a significantly increased density of inflammatory cells. (Right) At 28 days, inflammation is reduced, with a significant decrease in synovial size, but a dense cellularity is still observable. Scale bar = 100 µm.

