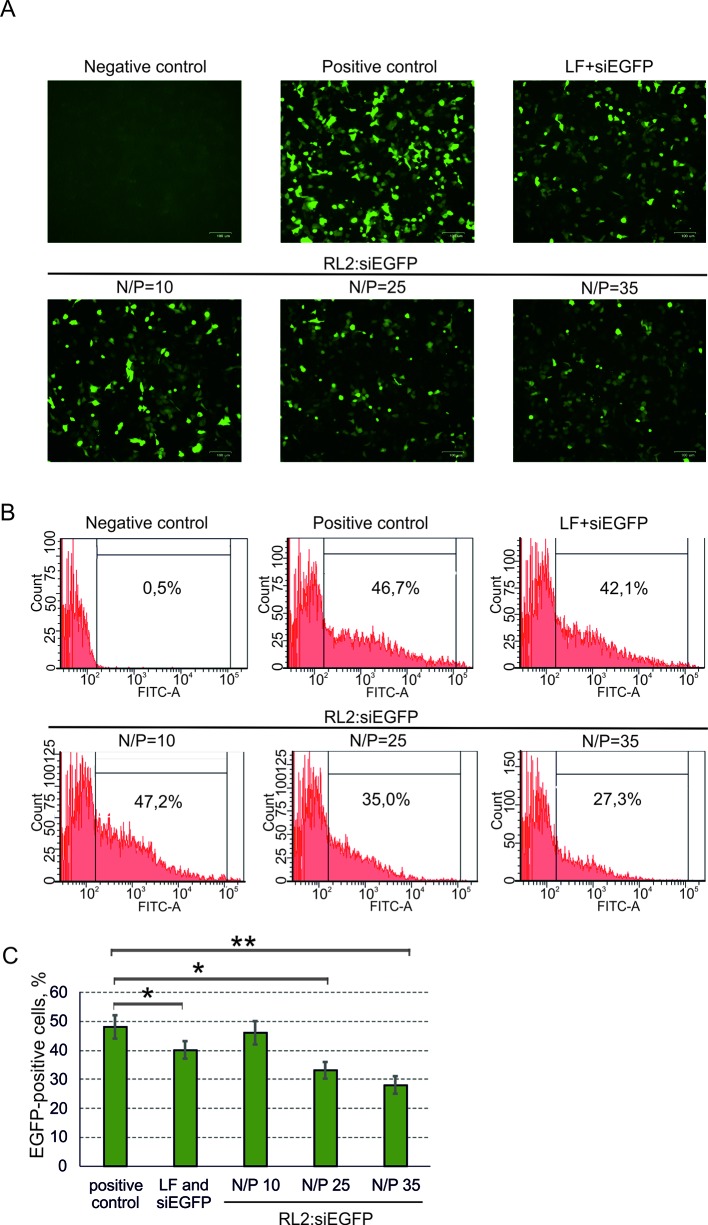
Figure 5.
Specific activity of anti-EGFP siRNA delivered into A549 cells as a RL2:siRNA complex. LF—Lipofectamine 3000. Negative control—cells were treated with naked pEGFP; positive control—cells treated with pEGFP and LF. (A) Representative images of fluorescent microscopy data; (B) Representative images of flow cytometry analysis. Representative images of EGFP-positive gate excludes EGFP-negative cells (relative to negative control). (C) Quantitative evaluation of EGFP down-regulation. The data are representative of three independent repeats and are shown as the mean ± SD. *P < 0.05; **P < 0.03.

