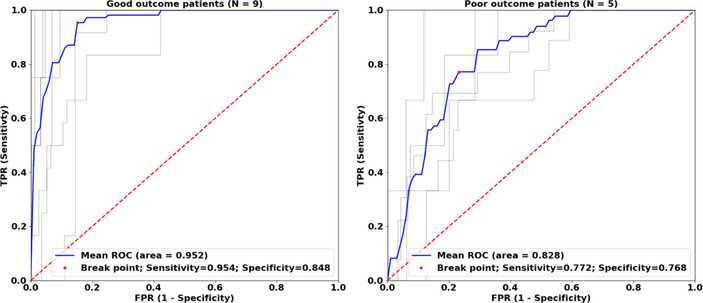
Figure 3.
ROC curves for Brno dataset with SOZ ⋂ resected area target. Grey lines represent classification of electrodes in individual patients during cross-validation iterations. Blue lines represent mean ROC curves. ROC analysis in poor outcome patients shows decreased performance indicating that some channels classified by the SVM model as pathologic were not resected.

