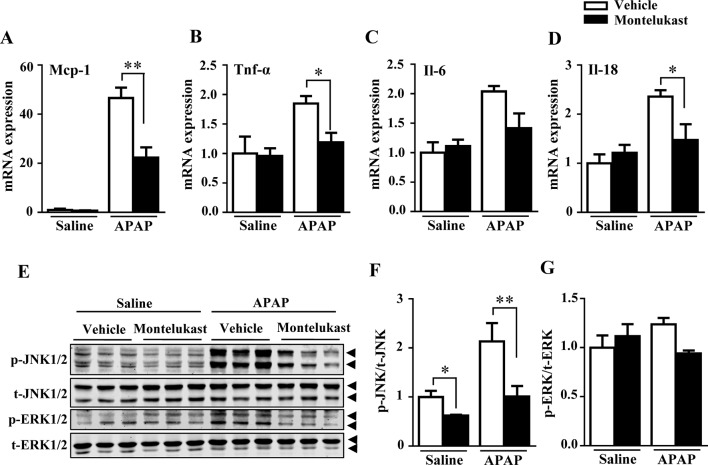
Figure 4.
Pharmacological inhibition of cysltr1 decrease APAP-induced hepatic inflammation. (A–D) Real-time PCR analysis of hepatic inflammatory cytokine genes expression, n = 5 for saline groups, n = 7 for APAP groups. (E) Western blotting analysis ERK and JNK phosphorylation. (F and G) Quantification of phosphorylated JNK to total JNK and phosphorylated ERK to total ERK. Data are mean ± SEM, n = 3 for each groups, *p < 0.05, **p < 0.01. Experiments were repeated three times with similar results.

