
Figure 4.
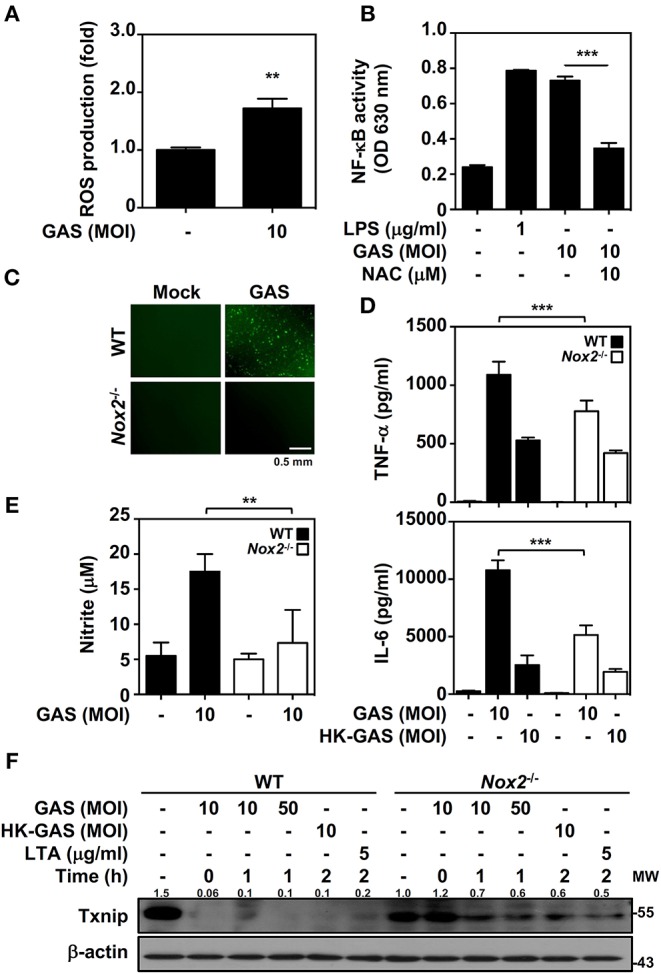
NADPH oxidase regulates NF-κB activation and Txnip degradation in GAS infection. (A) BMDMs were infected with GAS for 1 h followed by ROS detection. Data are shown as the means ± SD of triplicate cultures. **p < 0.01. (B) In the presence or absence of NAC, the relative NF-κB activities were determined in RAW-Blue cells infected with GAS for 24 h. Data are shown as the means ± SD of triplicate cultures. ***p < 0.001. LPS treatment was used as a positive control. (C) Fluorescence microscopic analysis showed ROS generation (green) in wild-type (WT) and Nox2−/− BMDMs infected with GAS (MOI 10). The scale bar is shown. (D) TNF-α and IL-6 production in WT or Nox2−/− BMDMs infected with GAS or HK-GAS for 24 h were measured and shown as the means ± SD of triplicate cultures. ***p < 0.001 compared with GAS-infected WT. (E) NO production in GAS-infected WT and Nox2−/− BMDMs for 24 h was detected and shown as the means ± SD of triplicate cultures. **p < 0.01 compared with GAS-infected WT. (F) Western blotting showed Txnip expression in WT and Nox2−/− BMDMs infected with GAS or treated with HK-GAS or LTA for the indicated times. β-actin was used as an internal control. The expression ratios of Txnip to internal controls are shown. Protein molecular weights (MW) are indicated in kilodaltons. Western blot results represent at least two independent experiments.