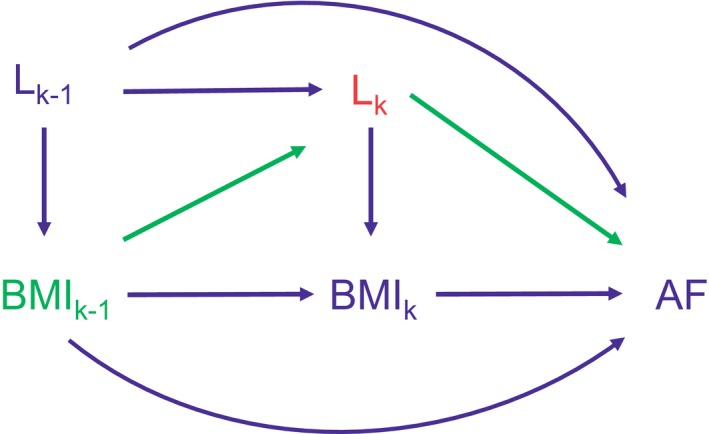
Figure 1.

Directed acyclic graph of body mass index, other time‐varying covariates, and atrial fibrillation. The directed acyclic graph displays repeated measures at years k−1 and k. BMI k denotes the exposure, body mass index (BMI), at year k. Lk denotes confounders at year k (eg, systolic blood pressure). AF denotes the outcome, new‐onset atrial fibrillation (AF). Arrows indicate associations (eg, the association of body mass index [BMI] and incident AF). Adjustment for intermediate variables Lk (red) in a Cox model will block the path between BMI k−1 and AF (green), which prevents us from observing the full association. However, g‐methods can accommodate this scenario. If BMI k−1 did not cause AF through Lk (the green arrows were not present), then Lk would not be an intermediate variable and adjustment for Lk would not block the association of BMI k−1 and AF.
