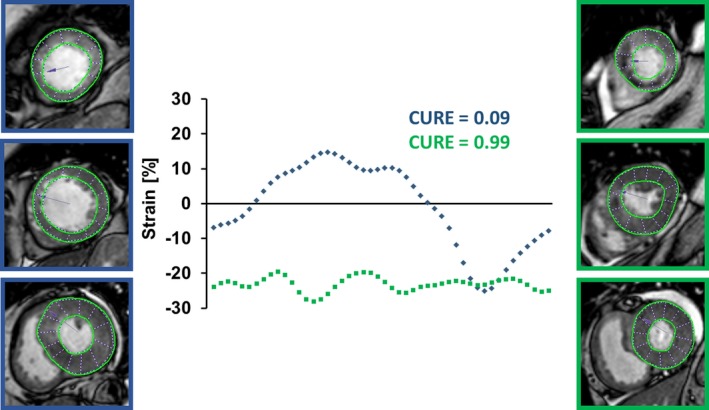
Figure 1.

Derivation of uniformity ratio estimates from cardiac magnetic resonance myocardial feature tracking. Global circumferential strain values (GCS) are plotted at 48 evenly distributed locations against their spatial positions during the cardiac cycle. Assuming that equal strain across the myocardium at any given time results in perfect uniformity, CURE/RURE=1. Spatially divergent strain values result in oscillations within the plots representing myocardial uniformity alterations with a peak at CURE/RURE=0. The blue dotted line represents CURE at end‐systole of a patient with extensive uniformity alterations and MACE during follow‐up. The green dotted line represents CURE at end‐systole of a patient with uniform contraction and no MACE during follow‐up. CURE indicates circumferential uniformity ratio estimate; MACE, major adverse cardiac events; RURE, radial uniformity ratio estimate.
