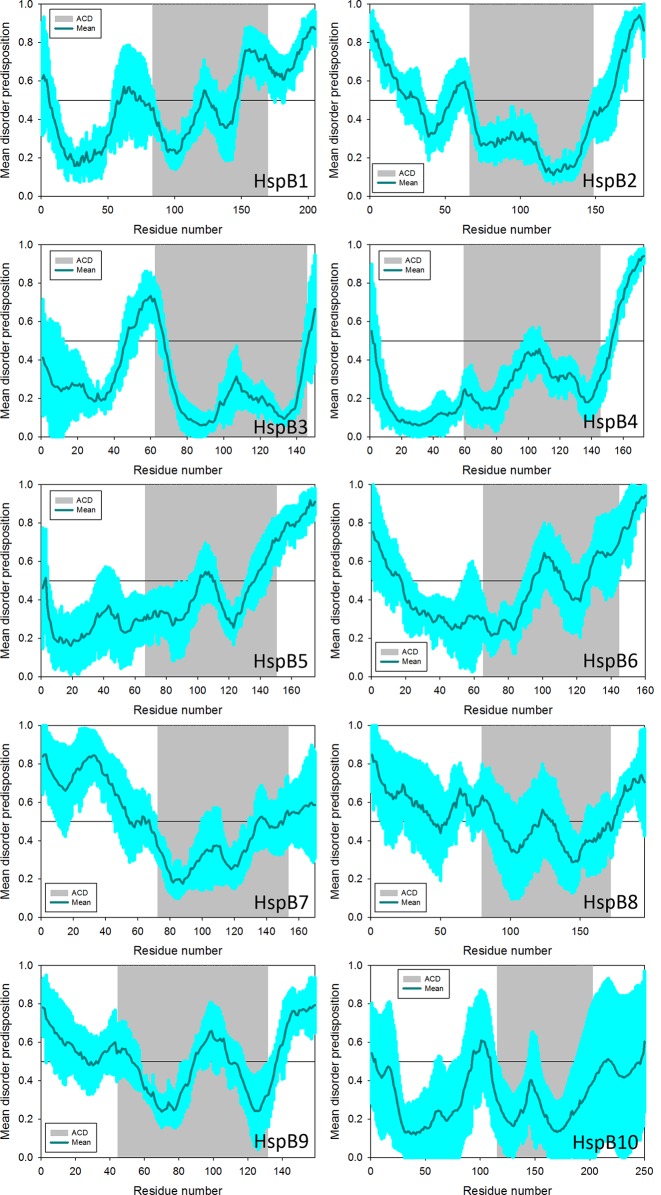
Figure 1.
Intrinsic disorder profiles generated for human HspB1 (UniProt ID: P04792), HspB2 (UniProt ID: Q16082), HspB3 (UniProt ID: Q12988), HspB4 (UniProt ID: P02489), HspB5 (UniProt ID: P02511), HspB6 (UniProt ID: O14558), HspB7 (UniProt ID: Q9UBY9), HspB8 (UniProt ID: Q9UJY1), HspB9 (UniProt ID: Q9BQS6), and HspB10 (UniProt ID: Q14990), visualized as the mean of 6 commonly used disorder predictors from the PONDR family, PONDR® VLXT, PONDR® VSL2, PONDR® VL3, PONDR® FIT, IUpred_short and IUpred_long. In these plots, disorder score exceeding the 0.5 threshold correspond to intrinsically disordered regions, whereas disorder score ranging from 0.2 to 0.5 show flexible regions. The light cyan shade around disorder predisposition curves represents error (SD) distribution. The grey shaded background corresponds to the ACD of each sHsp sequence to facilitate discrimination from the terminal domains.

