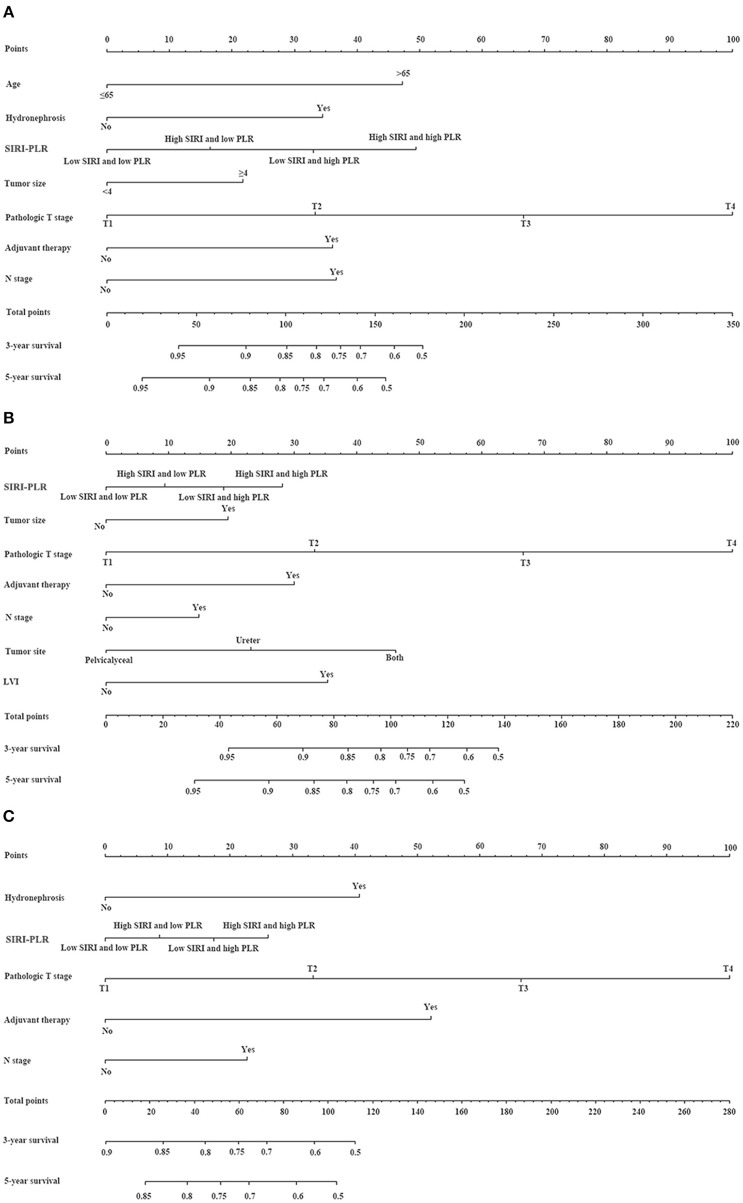
Figure 4.
Establishment of nomograms for the prediction of OS (A), CSS (B), and MFS (C) in patients with UTUC after surgery. To use the nomogram, the value of individual patients with UTUC is shown on each variable axis, and a line is depicted upward to determine the number of points received for each variable value. Subsequently, the sum of these numbers is located on the total point axis, and a line is drawn downward to the survival axes to determine the likelihood of 3- and 5-year survival of OS, CSS, and MFS.

