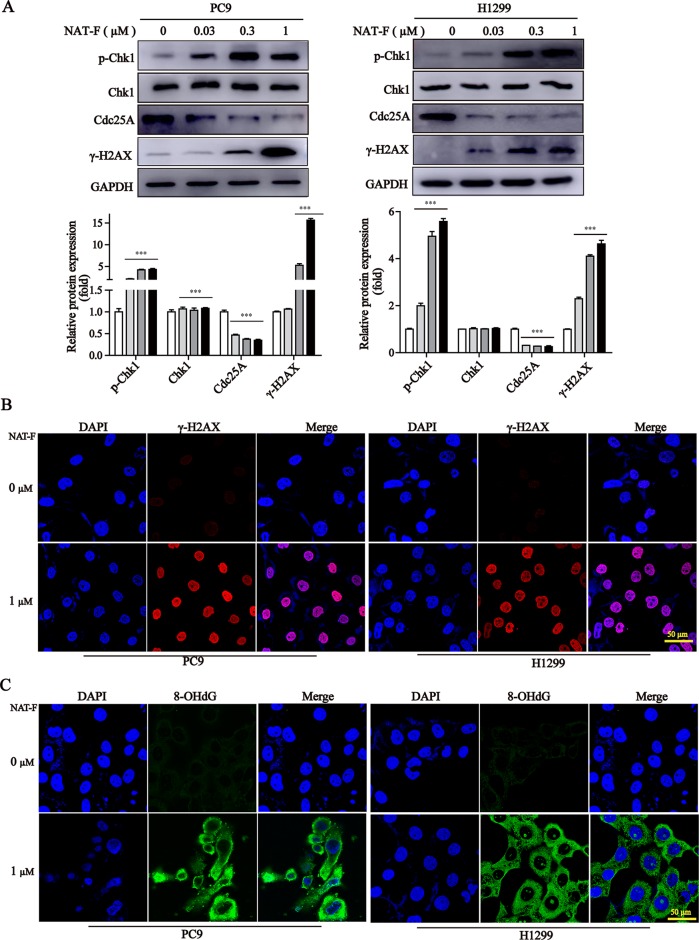
Figure 3.
NAT-F induced DNA damage in NSCLC cells. (A) The DNA damage regulatory proteins in PC9 and H1299 cells were detected by Western blotting. In PC9 cells, samples of p-Chk1, Chk1, and Cdc25A were from the same gels; samples of GAPDH and γ-H2AX were from the same gels. In H1299 cells, samples of p-Chk1, Chk1, Cdc25A, and GAPDH were from the same gels; samples of γ-H2AX were from the same gels. GAPDH was used as internal control. Western blot assay was carried out at least 3 times, and data represented mean ± SD. Significant differences were indicated by ***p < 0.001 versus the control. (B) Immunofluorescence images (630× magnification) of γ-H2AX in PC9 and H1299 cells treated with or without NAT-F(1 μM) treatments for 36 h, respectively. The red fluorescence indicated γ-H2AX foci and the blue fluorescence indicated cell nuclei, respectively. Bar: 50 μm. (C) Immunostaining of 8-OHdG in PC9 and H1299 cells with or without NAT-F(1 μM) treatments for 36 h. Representative images (630×magnification) of DAPI (blue color), 8-OHdG staining (green color), and merged were shown for each group of cells. Bar: 50 μm.

