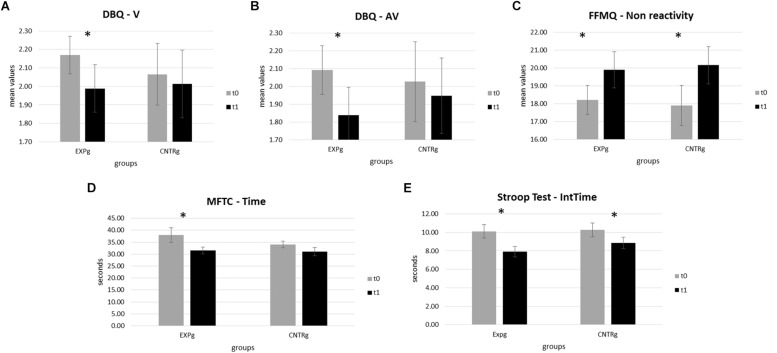
FIGURE 2.
Psychometric and neuropsychological measures significant results. (A) Mean values of DBQ Violations for both groups at t0 and at t1. (B) Mean values of DBQ Aggressive Violations for both groups at t0 and at t1. (C) Mean values of FFMQ Non-reactivity subscale scores for both groups at t0 and at t1. (D) Mean values of seconds for MFCT Time performance for both groups at t0 and at t1. (E) Mean values of seconds for Stroop’s Test performance for both groups at t0 and at t1.

