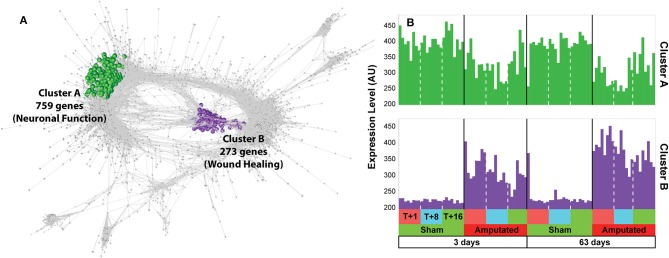
Figure 1.
Network analysis of gene expression data. (A) Co-expression graph (r ≥ 0.75) with two clusters, A and B, highlighted. Cluster A (highlighted in green) contains 759 transcripts whose expression was down-regulated following tail docking and comprising many genes associated with neuronal function. Cluster B (highlighted in purple) contains 273 transcripts consistently upregulated following tail docking and comprising many genes associated with wound healing. (B) Histograms of mean expression profiles for cluster A (green) and cluster B (purple), each bar representing data from a single animal.

