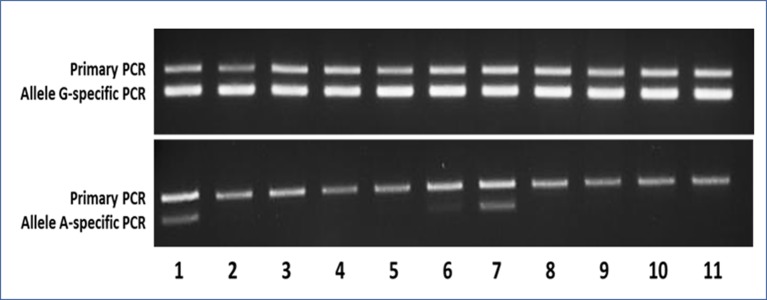
Figure 3.
Representative agarose gels of the AS-PCR for the detection of the c.605G > A variant showing both the aspecific primary PCR on top and the allele-specific nested PCR below amplicon bands. In the upper gel, as expected, the G-specific amplicon was appreciable for each sample, whereas in the lower gel, the A-specific amplicon was detectable only in samples bearing the mutant A allele. Samples 1–9 were MAS patients (1–2 = pt46-OC+OT; 3–5 = pt47-BL+OC+OT; 6–7 = pt48-BL+OT; 8–9 = pt49-BL+OT), whereas samples 10 and 11 were WTCs.

