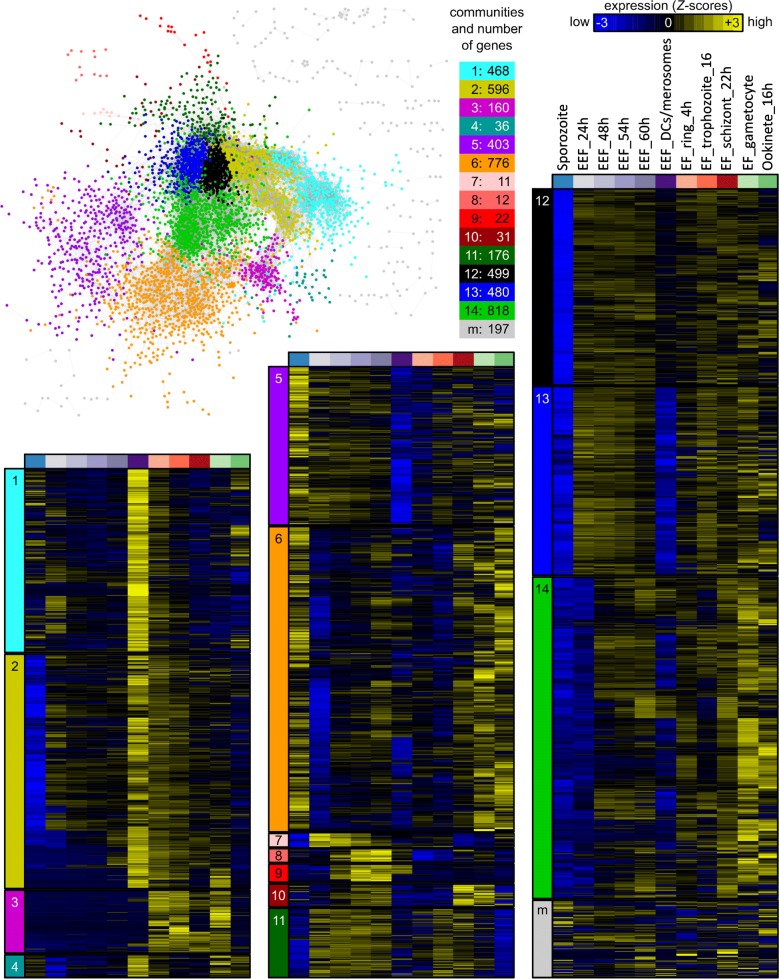
Fig. 2.
Gene co-expression network based on RNA-seq data of samples of different life cycle stages. Stages are sporozoites, exo-erythrocytic (EEF) stages (DCs/merosomes correspond to detached cells and merosomes), erythrocytic (EF) stages (rings, trophozoites, schizonts, gametocytes) and ookinetes. Each node represents a gene and each edge depicts a significant pairwise correlation. The network was visualized with Cytoscape [45] using the “prefuse force directed layout”. Nodes/genes are colored according to their membership in 14 communities and a ‘mixed’ (M) community (pool of communities with less than 11 genes per community), identified with a modularity optimization algorithm [43]. For each community, a heatmap summarizes the expression patterns of all genes within the community. Expression values in the heatmaps correspond to gene-wise Z-scored of normalized and log2(x + 1)-transformed count data averaged across the replicates

