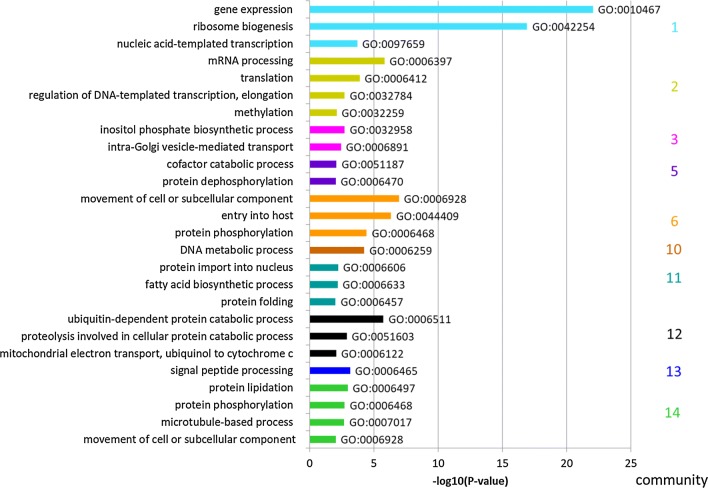
Fig. 3.
GO terms in GCN communities (expressed as − log10(P-value)). The colors refer to the different communities in Fig. 1b. Only GO-terms with P-values < 0.01 were included. Communities containing less than 25 genes were ignored because of potential false significance (following recommendations in GeneSetEnrichmentAnalysis from the Broad Institute)

