Fig. 5.

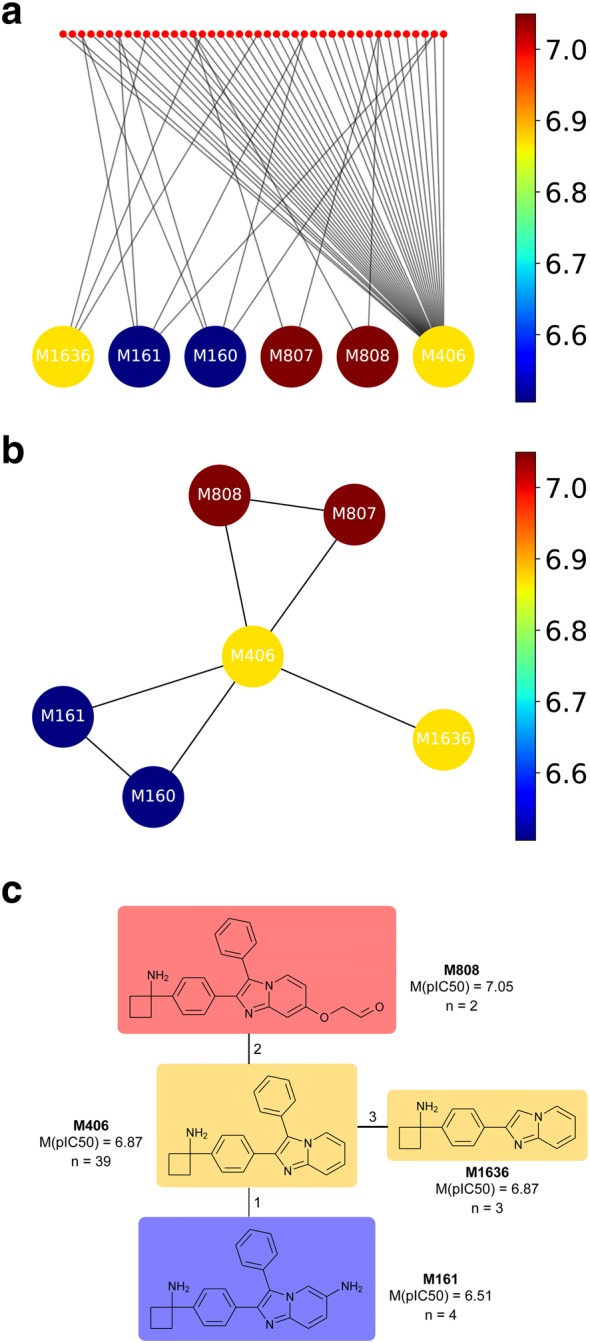
Core structure–activity relationship visualization for the largest series in a dataset of Akt2 inhibitors. a Molecule–core bipartite network. Molecules are shown as small red dots, while cores are represented as larger dots and colored by the median of the pIC50 of the molecules represented by them. b Core network obtained from the molecules-cores bipartite network. Nodes are putative cores and edges are drawn between nodes that share at least one compound in the dataset; c final CSAR visualization. Redundant cores were omitted and chemical structures were added to the core’s network
