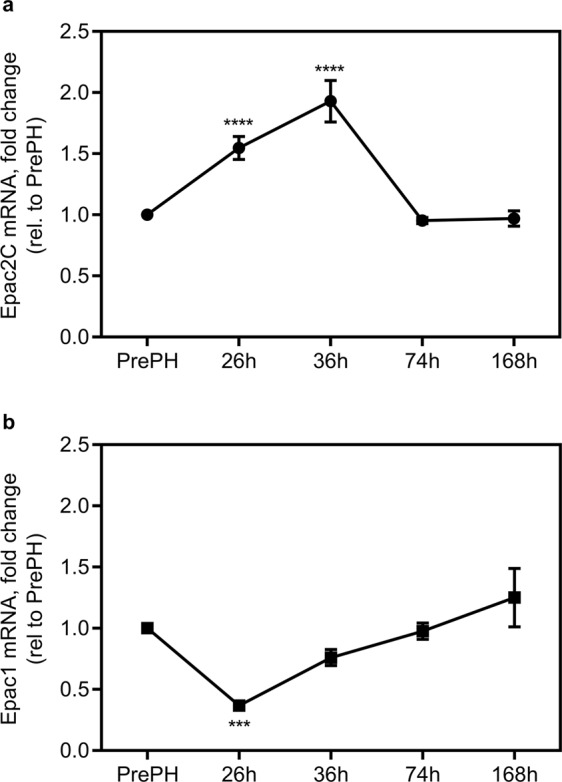
Figure 2.

The expression of Epac2C mRNA is increased in liver after PH. qPCR analysis of (a) Epac2C and (b) Epac1 mRNA in liver pre-PH or 26 h, 36 h, 74 h and 168 h post-PH in wt mice. The CT values for resected tissue (4.39 ± 0.12 for Epac2C and 12.29 ± 0.38 for Epac1) were set to 1. Data are expressed as mean ± SD of three separate experiments performed in triplicates. One-way ANOVA with Dunnett’s adjustment for multiple comparisons was used to determine statistical differences. ***p < 0.001 and ****p < 0.0001: mRNA levels in wt livers pre-PH compared to mRNA levels in wt livers at the different postoperative time points (26 h, 36 h, 74 h or 168 h post-PH). F-statistics (a): F(4,9) = 75.57, p < 0.0001 and (b): F(4,10) = 24.50, p < 0.0001.
