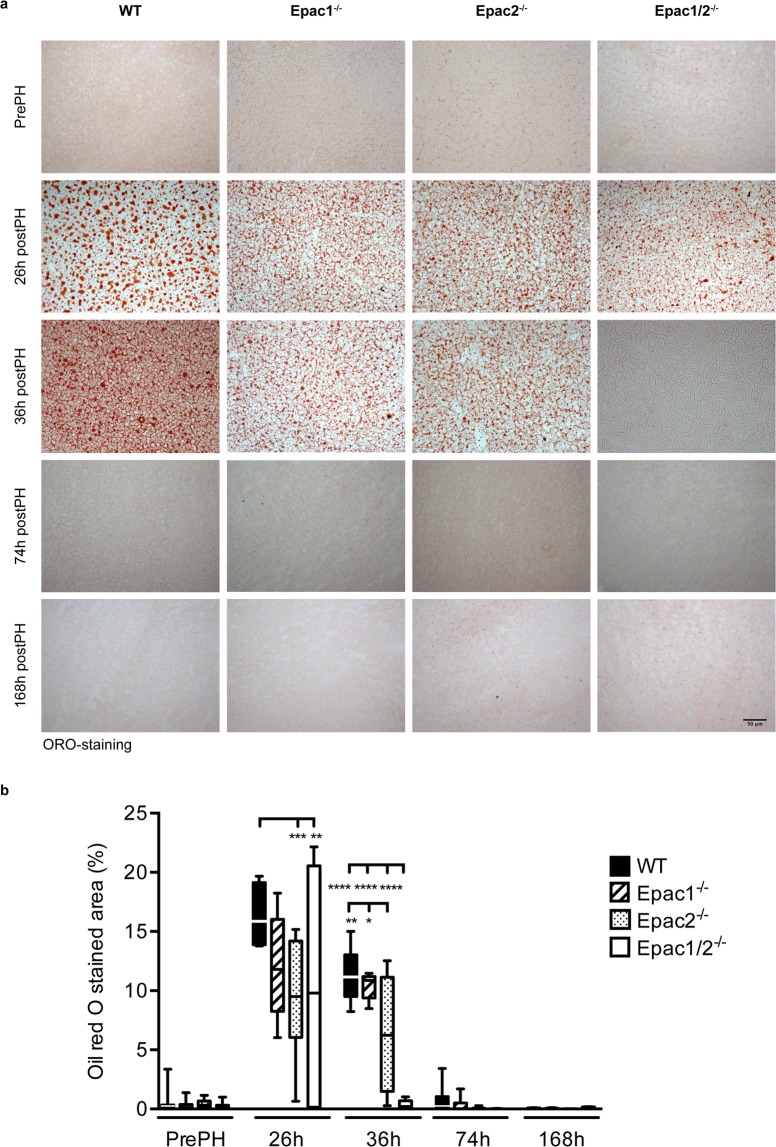
Figure 4.
Epac1/2−/− mice are devoid of fat vacuoles 36 h post-PH. ORO staining of sections from livers from wt, Epac1−/−, Epac2−/− and Epac1/2−/− mice pre- and post-PH as indicated (20x). (a) Representative images of ORO staining. (b) Quantification of ORO-staining. The median and left lateral lobes resected during surgery were used as control tissue in these experiments. Data are shown as box and whiskers with median and min to max whiskers, n = 4–8 mice/group post-PH and n = 17–23 mice/group pre-PH. Two-way ANOVA with Bonferroni’s adjustment for multiple comparisons was used to determine statistical differences between genotypes within each time point. *p < 0.05, **p < 0.01, ***p < 0.001 and ****p < 0.0001. F-statistics: F(12,149) = 5.152, p < 0.0001.

