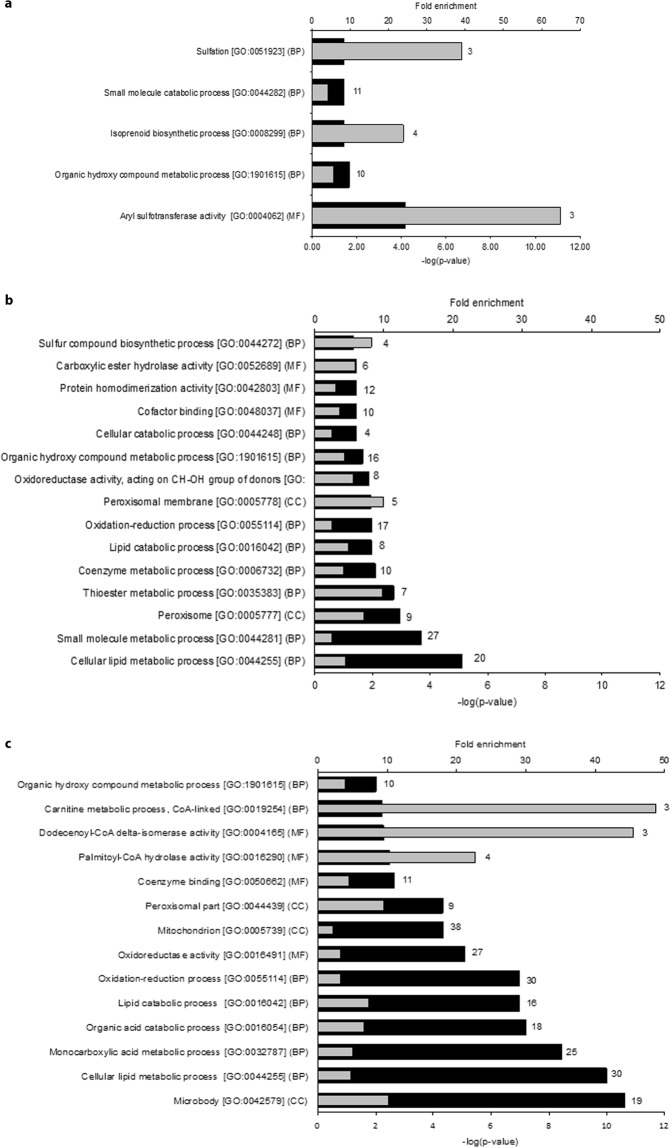
Figure 5.
Functional annotation of differentially expressed proteins. GO enrichment analyses on proteins that were differentially expressed in wt and Epac1/2−/− mice (a/b) pre- or (c) 36 h post-PH. (a) Functional annotation of proteins with significantly higher expression pre-PH in Epac1/2−/− mice compared to wt. (b) Functional annotation of proteins with significantly lower expression pre-PH in Epac1/2−/− mice compared to wt. (c) Functional annotation of proteins with significantly lower expression post-PH in Epac1/2−/− mice compared to wt. Black bars indicate the respective p-values and grey bars indicate fold enrichment for the corresponding GO-term. The number of proteins annotated with each GO-term is shown behind each bar. BP: biological processes; MF: molecular function (MF); CC: cellular compartment.

