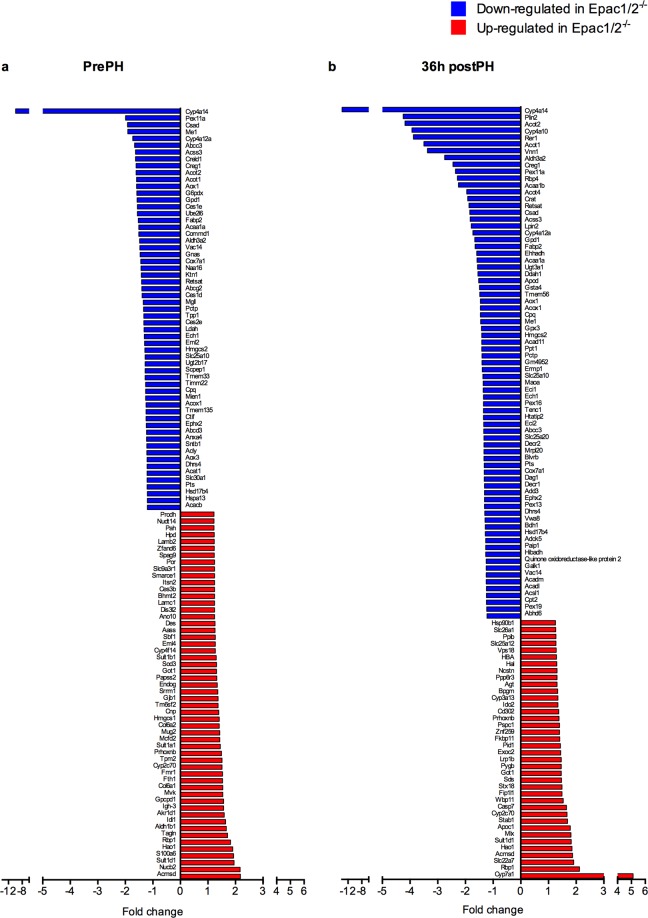
Figure 6.
Differentially expressed proteins in Epac1/2−/− mice compared to wt. The proteins that were differently expressed in Epac1/2−/− mice compared to wt mice (a) pre- and (b) post-PH are listed. Blue bars indicate proteins that were decreased in Epac1/2−/− mice compared to wt mice, and red bars indicate proteins that were increased in Epac1/2−/− mice compared to wt mice. Statistics: two-tailed student’s two-sample t-test and Z-statistics for FC, only when p < 0.05 for both it was considered significant.

