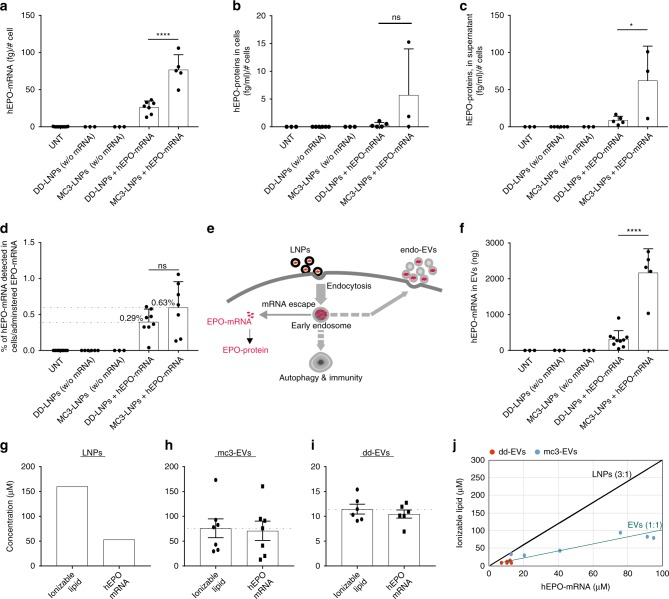
Fig. 1.
Delivery of hEPO mRNA to cells via LNPs and analysis of endo-EVs. MC3-LNPs and DD-LNPs containing 100 μg of hEPO-mRNA were transferred to human epithelial (HTB-177) cells. Untreated cells and cells treated with empty LNPs (without hEPO mRNA) were used as controls. a Amount of hEPO mRNA detected in cells. Untreated (n = 9), DD-LNPs (w/o mRNA) (n = 3), MC3-LNPs (w/o mRNA) (n = 3), DD-LNPs + mRNA (n = 7), and MC3-LNPs + mRNA (n = 5). b Amount of hEPO protein detected in cells. Untreated (n = 3), DD-LNPs (w/o mRNA) (n = 6), MC3-LNPs (w/o mRNA) (n = 3), DD-LNPs + mRNA (n = 5), and MC3-LNPs + mRNA (n = 3). c Amount of hEPO protein detected in the supernatant of cultured cells. Untreated (n = 3), DD-LNPs (w/o mRNA) (n = 6), MC3-LNPs (w/o mRNA) (n = 3), DD-LNPs + mRNA (n = 5), and MC3-LNPs + mRNA (n = 3). d Percentage of hEPO mRNA detected in the cytosol of cells relative to the total amount of mRNA administered (100 µg) to cells via LNPs. Untreated (n = 10), DD-LNPs (w/o mRNA) (n = 6), MC3-LNPs (w/o mRNA) (n = 3), DD-LNPs + mRNA (n = 8), and MC3-LNPs + mRNA (n = 7). e Hypothetical presentation of the endosomal escape of hEPO mRNA of LNPs into the cytoplasm and translation into protein, versus loading of hEPO mRNA into endo-EVs. f Total amount of hEPO mRNA quantified in endo-EVs isolated from LNP-treated cells. Untreated (n = 3), DD-LNPs (w/o mRNA) (n = 3), MC3-LNPs (w/o mRNA) (n = 3), DD-LNPs + mRNA (n = 10), and MC3-LNPs + mRNA (n = 5). g Molar concentrations of ionizable lipids and hEPO-mRNA (ionizable lipids per hEPO mRNA nucleotides) in originally formulated LNPs (control, n = 1), which contains 3 moles of ionizable lipids per 1 mole of mRNA nucleotides. h Molar concentration of ionizable lipids and hEPO-mRNA of mc3-EVs (n = 7). i Molar concentration of ionizable lipids and hEPO-mRNA of dd-EVs (n = 6). j Stoichiometric comparison between LNPs and endo-EVs regarding molar ratio (mole/mole) of ionizable lipids per hEPO-mRNA nucleotides. Red circles (dd-EV) and blue circles (mc3-EV). Ionizable lipids and hEPO-mRNA of mc3-EVs (n = 7) each. Ionizable lipids and hEPO-mRNA of dd-EVs (n = 6) each. Data are presented as scatter dot plots including the mean (bars) and standard deviation (SD) of the number (n) of biologically independent samples specified for each panel. MC3-LNP and DD-LNP groups (a–d, f) were compared using the unpaired two-tailed Student’s t-test. **p < 0.01, ****p < 0.0001 and ns = not significant. Source data are provided as a Source Data file

