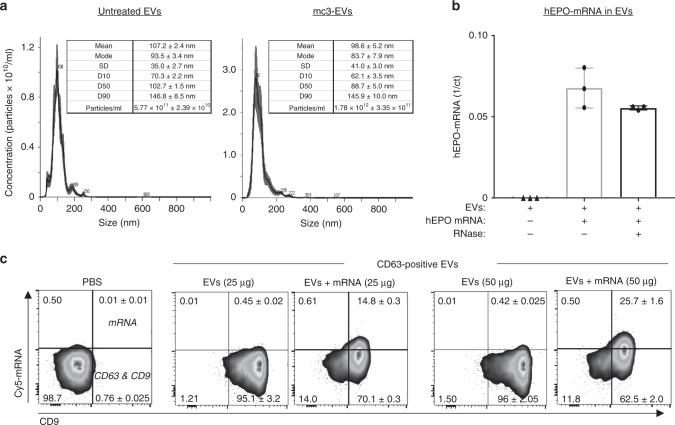
Fig. 2.
Characterization of endo-EVs derived from LNP-treated cells. a Nanoparticle tracking analysis for size distribution and concentration of EVs from untreated cells (Left side panel) and from MC3-LNP-treated cells (Right side panel). For each graph (one representative replicate), a table is provided, including mean and mode sizes, SD, and D-values (D10, D50, D90) and particle concentration. b EV-mRNA protection assay against RNase A. The hEPO-mRNA qPCR data is represented as scatter dot plot and mean SD of n = 3 biologically independent samples. c Cy5 mRNA in CD63/CD9 positive EVs. CD63+ EVs were stained against CD9 antibody and analyzed by FACS for Cy5 mRNA detection. The sole beads incubated with PBS instead of EVs are shown as negative control. Approximately 96% of immunoprecipitated EVs (50 µg assay) from untreated cells are positive for CD63 and CD9 but they are negative for mRNA. By contrast, ~88% of immunoprecipated EVs (50 µg assay) from LNP-treated cells are positive for CD63 and CD9, and 26% EVs contain mRNA that is secreted after the endocytosis of LNP-mRNA. The percentage of CD63/CD9 positive EVs containing Cy5 mRNA is presented in the upper right quadrant. The FACS dot plots represent Cy5 mRNA (y-axis) vs. CD9 (x-axis). One out of two biological replicates is shown. Source data are provided as a Source Data file

