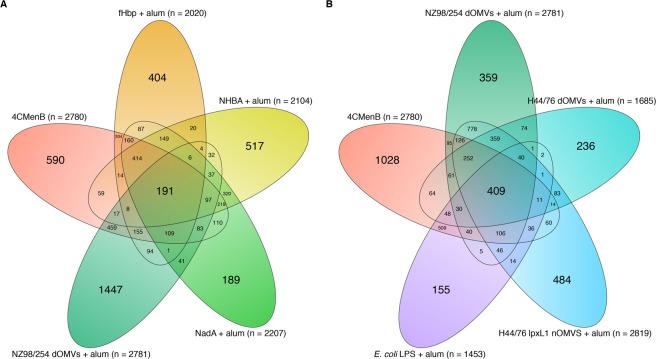
Figure 4.
Global changes in gene expression at 24 hours. Euler plots of the total number of significantly differentially expressed genes (DEGs, FDR-adjusted p-value < 0.01) associated with each test group 24 hours after the second dose. (A) Overlap between DEGs associated with 4CMenB, and each of its alum-adsorbed components. (B) Overlap between 4CMenB, each of the alum-adsorbed deoxycholate and native outer membrane vesicles (dOMVs and nOMVs), and alum-adsorbed lipopolysaccharide (LPS) from Escherichia coli.

