Figure 8.
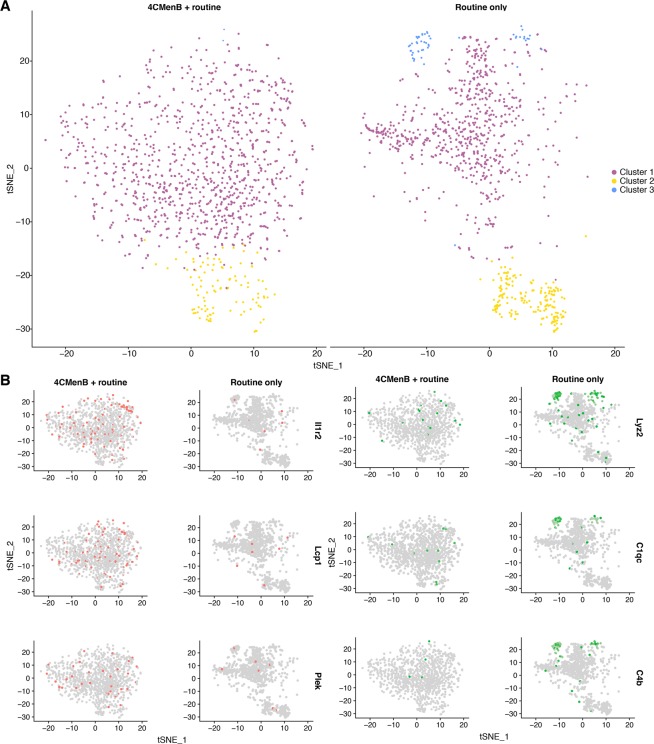
T-distributed stochastic neighbour embedding plots generated from canonical correlation analysis of neutrophils isolated from mouse whole blood, 24 hours after immunisation. (A) Clustering of canonical correlation analysis (CCA)-aligned neutrophils, isolated and sequenced from pooled whole blood of mice (n = 6 per group) taken 24 hours after the second dose of 4CMenB + routine and routine only immunisations. Neutrophil clusters were determined by t-distributed stochastic neighbour embedding (tSNE) dimensionality reduction during integrated analysis of CCA-aligned cells from both conditions. (B) Feature plot maps of top genes identified by differential expression analysis for each condition, with cells highlighted based on scaled expression values greater than one log2 fold change above the median across all cells. The cells highlighted in red correspond to those expressing the top genes, Il1r2, Lcp1, and Plek, identified as positively differentially expressed in the 4CMenB + routine group relative to the routine only group and those highlighted in green correspond to those expressing the top genes, Lyz2, C1qc, C4b, identified as positively differentially expressed in the routine only group relative to the 4CMenB + routine group.

