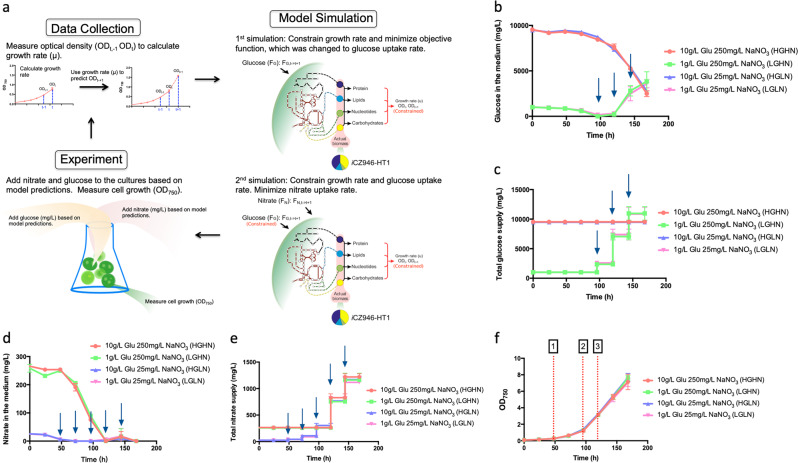
Fig. 2.
Metabolic model control under heterotrophic conditions without constraints on glucose uptake rate. Arrows indicate the time points for feeding nutrients. a Algorithm of metabolic model control; b Glucose level in the medium (mg/L); c Total glucose supply during the culture (mg/L); d Nitrate level in the medium (mg/L); e Total nitrate supply during the culture (mg/L); f Growth curve (OD750). Point 1: 25 mg/L nitrate run out; Point 2: 1 g/L glucose run out; Point 3: 250 mg/L nitrate run out. The data represents the mean ± SD for n = 3

